Lebanon’s Trade Deficit Widened by 38% YoY to $4.75B in Q1 2026
According to the Lebanese Customs Administration, Lebanon’s trade deficit widened by 38% year-over-year (YoY) to $4.75 billion in Q1 2026. The shift was primarily driven by a 22.9% YoY surge in imports, which reached $5.38 billion in Q1 2026, coupled with a cumulative 32.5% YoY decline in exports to $631 million over the same period.
The rise in imports highlights Lebanon’s growing dependence on foreign goods as domestic production was severely disrupted by the war. Damage to infrastructure and factories, along with the displacement or loss/injury of workers due to conflict, significantly reduced the country’s production capacity for both local consumption and exports.
At the same time, shipping and transportation costs surged due to the closure of the Strait of Hormuz, the rise in energy prices, and the need to avoid unsafe or damaged routes. These factors made exports more expensive and caused delays in delivery. Insurance premiums on Lebanese exports also climbed, discouraging foreign buyers from purchasing local products.
Moreover, key export markets such as the UAE were directly impacted by the regional conflict, reducing demand for non-essential goods and further weakening Lebanon’s export performance.
Lebanon’s Trade Balance (USD Million)

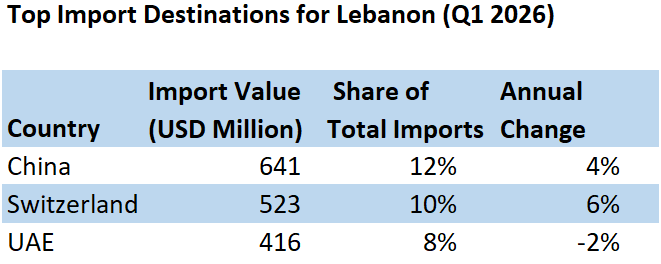
The top three import destinations during Q1 2026 were China, Switzerland, and the United Arab Emirates (UAE), accounting for 12%, 10%, and 8% of the total value of imports, respectively. The top imported products during the same period were mineral products (24%) at $1,290 million, pearls, precious stones, and metals (19%) at $1,012 million, and machinery and mechanical appliances (9%) at $461 million.
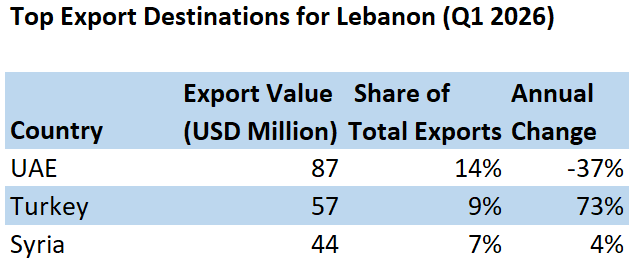
On the exports side, the top three destinations during Q1 2026 were the UAE, Turkey and Syria capturing respective shares of 14%, 9%, and 7% of the total value of exports. The top exported products during the same period were pearls, precious stones, and metals (20%) at $126 million, base metals and articles of base metal (19%) at $122 million, and prepared foodstuffs, beverages, and tobacco (15%) at $95 million.
Lebanon’s Trade Balance (USD Million) in Q1 (2019–2026):
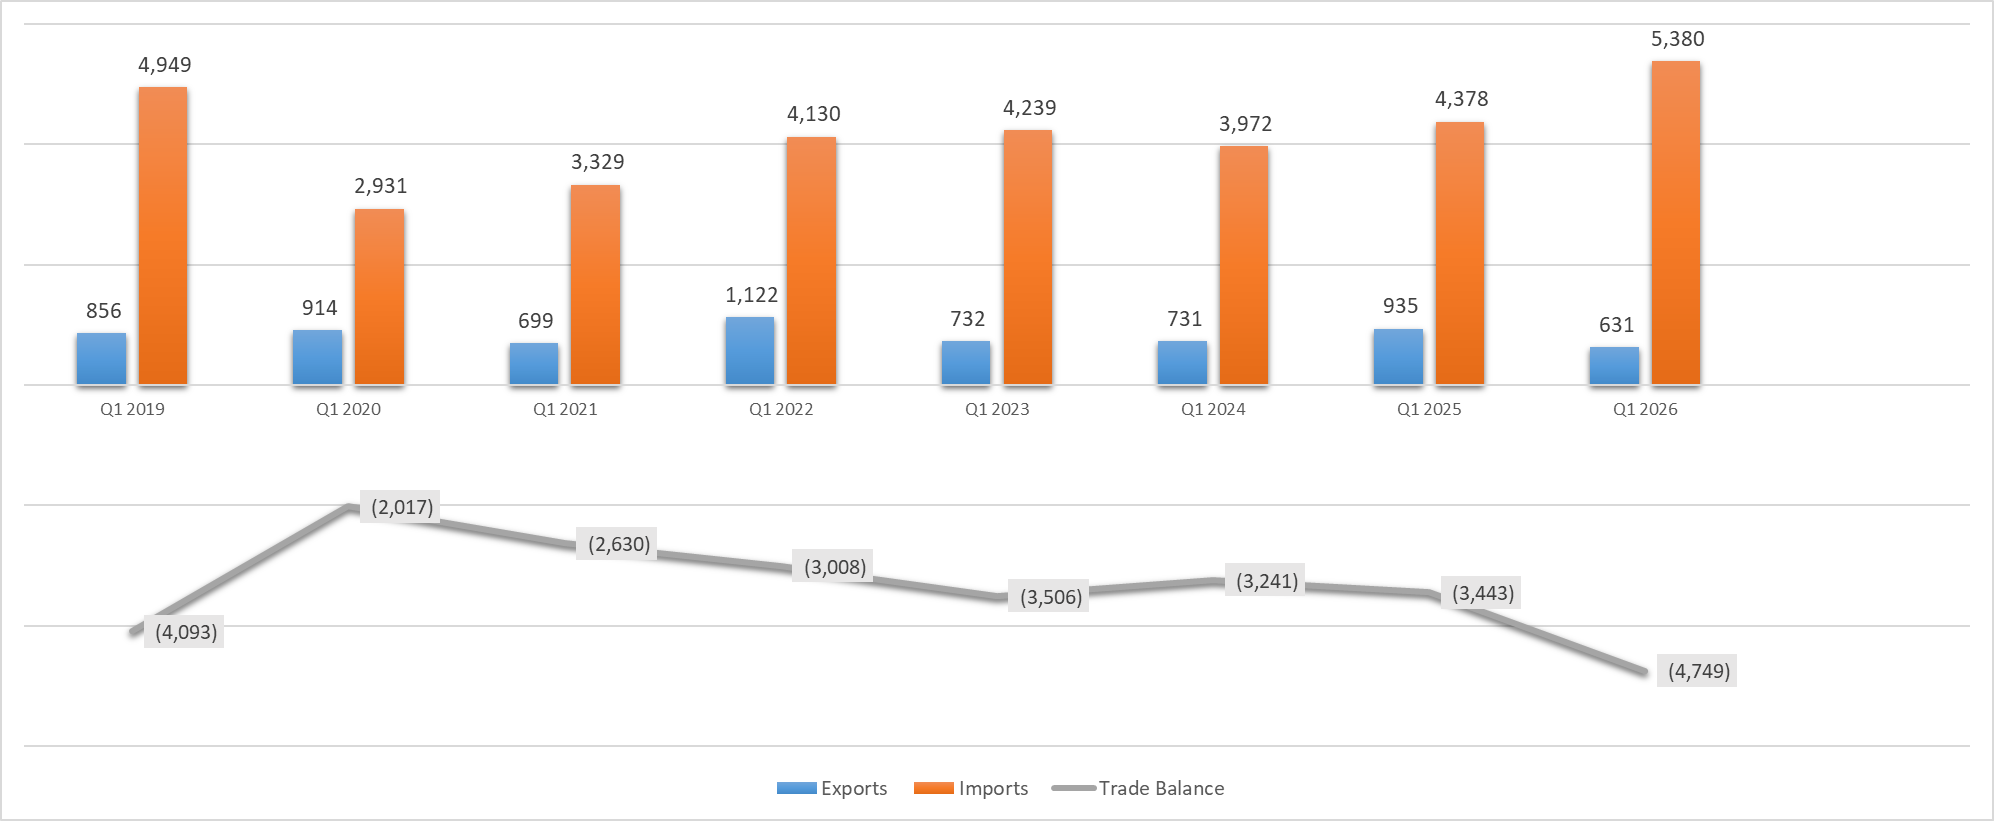
The chart indicates that Lebanon’s trade balance in Q1 2026 surpassed the trade deficit recorded in Q1 2019, and therefore exceeded pre‑crisis levels. However, despite a general recovery in exports after the financial crisis, Q1 2026 marked the weakest export performance among all first quarters in the period under review, including those before the crisis. At the same time, although imports initially declined following the currency devaluation, Q1 2026 registered the highest import levels of the entire studied period.