Discover today’s performance of BLOM indices, the closing prices of Lebanese stocks and Eurobonds, as well as the exchange rate of major currencies against the LBP.
BLOM Stock Index (BSI) – today’s performance
| Last | Previous | % Change | Y-t-D Change | |
| BSI | 798.18 | 798.85 | -0.08% | -18.29% |
| High | 798.90 | 801.70 | ||
| Low | 797.90 | 798.80 | ` | |
| Volume | 25,286 | 575,853 | ||
| Val ($) | 198,012 | 461,223 |
I): BLOM preferred Shares Index (BPSI): today’s Performance
| Last | Previous | Change | |
| BPSI | 79.82 | 80.23 | -0.51% |
| Volume | 500 | 2,400 | |
| Value | 32,250 | 149,900 |
Lebanese Stocks: today’s Trades and Closing Prices
| Last Price ($) | % Change | Volume | VWAP ($) | |
| Solidere A | 5.8 | -1.69% | 6,751 | 5.8 |
| Solidere B | 5.82 | 0.17% | 2,785 | 5.82 |
| Bank Audi | 3.7 | 0.27% | 250 | 3.70 |
| Byblos Bank Pref 2008 | 64 | -1.54% | 250 | 64.00 |
| Byblos Bank Pref 2009 | 65 | -0.99% | 250 | 65.00 |
| BLOM – Listed Shares | 7.3 | 0.14% | 15,000 | 7.30 |
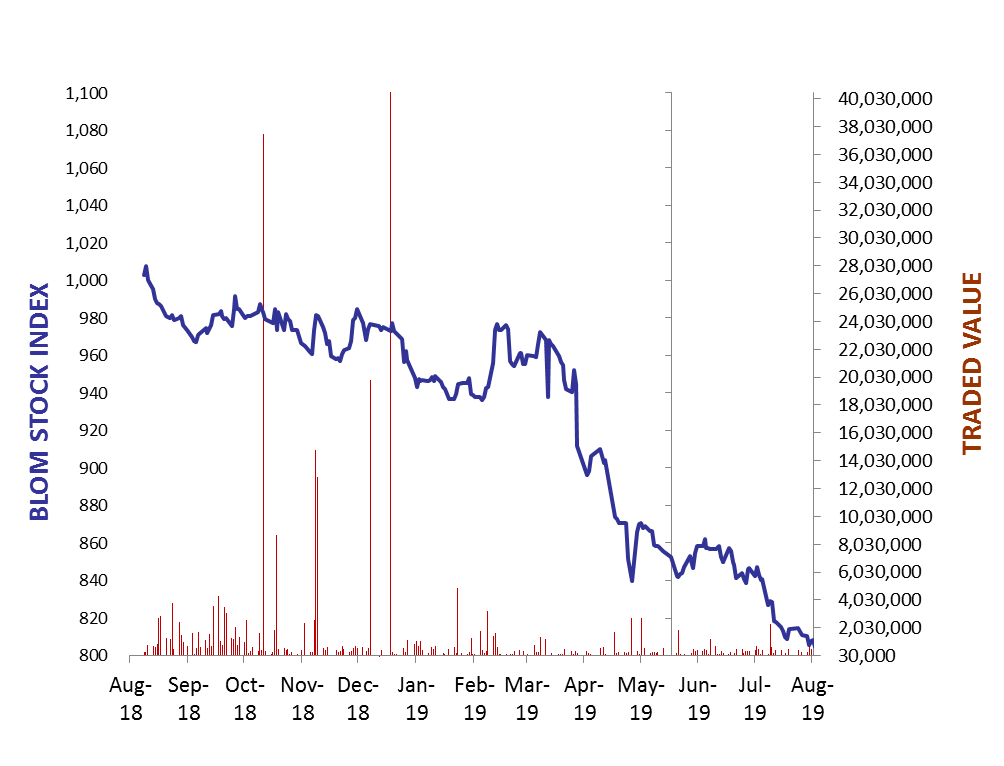
The BLOM Stock Index
Lebanese Global Depository Receipts: Last session’s Performance
| GDRs | Last Price ($) | Previous Price ($) | % Change | Volume | Value ($) |
| BLOM GDR | 6.90 | 6.95 | -0.72% | 4,942 | 34,100 |
| Audi GDR | 3.7 | 3.7 | 0.00% | ||
| Byblos GDR | 77 | 77 | 0.00% | – | – |
Closing Date: 28 Aug. 2019
Source: London Stock Exchange
BLOM BOND INDEX: Last Session’s Performance
| Last | Previous | Change | Y-t-D Change | ||
| BBI | 76.51 | 77.54 | -1.32% | -24.29% | |
| Weighted Yield | 14.98% | 14.62% | 36 | bps | |
| Duration (Years) | 4.83 | 4.85 | |||
| 5Y Bond Yield | 16.83% | 16.40% | 43 | bps | |
| 5Y Spread* | 1,541 | 1,497 | 44 | bps | |
| 10Y Bond Yield | 13.70% | 13.45% | 25 | bps | |
| 10Y Spread* | 1228 | 1,201 | 27 | bps | |
*between Lebanese Eurobonds and US Treasuries
Closing Date: 28 Aug 2019
Lebanese Eurobonds: Last Sessions’ Prices and Yields
| Price | Yield | Yield Change | |
| 12/04/2021 | 84.18 | 20.13% | 77 |
| 04/10/2022 | 74.58 | 16.97% | 50 |
| 27/01/2023 | 73.13 | 16.62% | 37 |
| 22/04/2024 | 70.83 | 15.72% | 36 |
| 04/11/2024 | 69.46 | 14.91% | 17 |
| 03/12/2024 | 68.89 | 15.94% | 90 |
| 26/02/2025 | 69.25 | 14.51% | 23 |
| 12/06/2025 | 69.54 | 14.12% | 26 |
| 28/11/2026 | 66.96 | 13.99% | 28 |
| 23/03/2027 | 66.62 | 14.18% | 21 |
| 29/11/2027 | 66.37 | 13.66% | 24 |
| 03/11/2028 | 66.58 | 12.98% | 19 |
| 26/02/2030 | 65.46 | 12.70% | 26 |
| 22/04/2031 | 65.59 | 12.74% | 17 |
| 23/03/2032 | 65.69 | 12.47% | 26 |
| 02/11/2035 | 65.50 | 11.90% | 25 |
| 23/03/2037 | 65.49 | 12.00% | 24 |
Lebanese Forex Market
| Last Price | Previous | % Change | Y-t-D | |
| $/LBP | 1,514.25 | 1,514.25 | – | |
| €/LBP | 1,669.25 | 1,669.86 | -0.04% | |
| £/LBP | 1,842.77 | 1,670.76 | 10.30% | |
| NEER | 120.26 | 120.20 | 0.05% |
Closing Date: 29 Aug. 2019