Discover today’s performance of BLOM indices, the closing prices of Lebanese stocks and Eurobonds, as well as the exchange rate of major currencies against the LBP.
BLOM Stock Index (BSI) – today’s performance
| Last | Previous | % Change | Y-t-D Change | |
| BSI | 793.58 | 796.71 | -0.39% | -18.76% |
| High | 795.00 | 796.80 | ||
| Low | 793.20 | 795.00 | ` | |
| Volume | 171,703 | 31,810 | ||
| Val ($) | 297,316 | 189,899 |
I): BLOM preferred Shares Index (BPSI): today’s Performance
| Last | Previous | Change | |
| BPSI | 80.07 | 80.07 | 0.00% |
| Volume | 1,080 | – | |
| Value | 70,200 | – |
Lebanese Stocks: today’s Trades and Closing Prices
| Last Price ($) | % Change | Volume | VWAP ($) | |
| Solidere A | 5.72 | -4.19% | 8,262 | 5.75 |
| Byblos Bank – Listed Shares | 1.11 | -0.89% | 162,361 | 1.11 |
| Byblos Bank Pref 2009 | 65 | 0.00% | 1,080 | 65 |
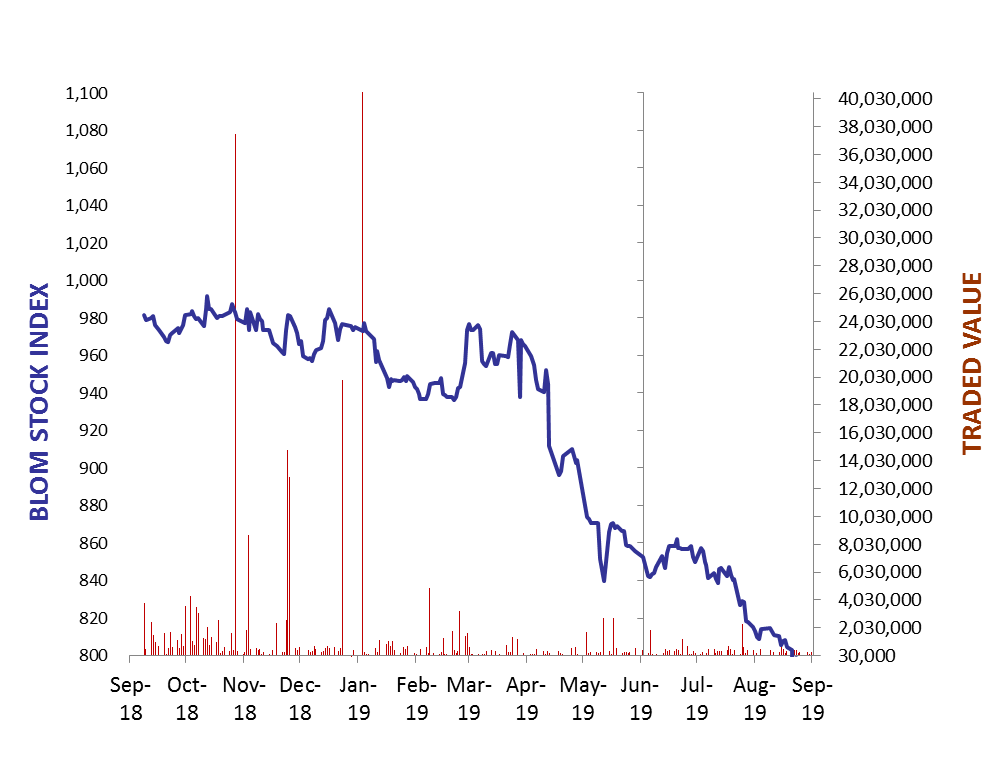
The BLOM Stock Index
Lebanese Global Depository Receipts: Last session’s Performance
| GDRs | Last Price ($) | Previous Price ($) | % Change | Volume | Value ($) |
| BLOM GDR | 6.85 | 7 | -2.14% | 39,578 | 273,227 |
| Audi GDR | 3.62 | 3.62 | 0.00% | ||
| Byblos GDR | 70 | 70 | 0.00% | – | – |
Closing Date: 12 Sept. 2019
Source: London Stock Exchange
BLOM BOND INDEX: Last Session’s Performance
| Last | Previous | Change | Y-t-D Change | ||
| BBI | 74.67 | 74.44 | 0.30% | -26.11% | |
| Weighted Yield | 15.72% | 15.75% | -3 | bps | |
| Duration (Years) | 4.76 | 4.76 | |||
| 5Y Bond Yield | 18.60% | 18.46% | 14 | bps | |
| 5Y Spread* | 1,693 | 1,684 | 9 | bps | |
| 10Y Bond Yield | 14.15% | 14.15% | 0 | bps | |
| 10Y Spread* | 1,243 | 1,247 | -4 | bps | |
*between Lebanese Eurobonds and US Treasuries
Closing Date: 12 Sept. 2019
Lebanese Eurobonds: Last Sessions’ Prices and Yields
| Price | Yield | Yield Change | |
| 12/04/2021 | 83.69 | 20.85% | 15 |
| 04/10/2022 | 71.55 | 18.72% | 20 |
| 27/01/2023 | 69.73 | 18.43% | -2 |
| 22/04/2024 | 67.96 | 16.93% | -6 |
| 04/11/2024 | 67.01 | 15.86% | -17 |
| 03/12/2024 | 67.68 | 16.45% | 11 |
| 26/02/2025 | 67.01 | 15.34% | -7 |
| 12/06/2025 | 67.65 | 14.79% | -7 |
| 28/11/2026 | 64.81 | 14.66% | -10 |
| 23/03/2027 | 64.86 | 14.72% | -8 |
| 29/11/2027 | 64.71 | 14.14% | -3 |
| 03/11/2028 | 64.93 | 13.42% | -7 |
| 26/02/2030 | 64.75 | 12.88% | -13 |
| 22/04/2031 | 64.43 | 13.02% | -16 |
| 23/03/2032 | 64.82 | 12.68% | -12 |
| 02/11/2035 | 64.91 | 12.02% | -11 |
| 23/03/2037 | 64.91 | 12.12% | -11 |
Lebanese Forex Market
| Last Price | Previous | % Change | Y-t-D | |
| $/LBP | 1,514.25 | 1,514.25 | – | |
| €/LBP | 1,673.33 | 15,235.25 | -89.02% | |
| £/LBP | 1,878.65 | 1,858.90 | 1.06% | |
| NEER | 119.26 | 119.65 | -0.33% |
Closing Date: 13 Sept. 2019