What Drove The Two-Digit Trade Deficit In Lebanon in 2022?
The Lebanese economy is highly reliant on international trade with larger importations generally driven by the notable strength of private consumption and relative lack of local industries in light of the open policy adopted by the Lebanese government that encouraged greater trade flows. While economists disagree on the simple question whether sustained trade deficits are good or bad for the country, and attribute a larger trade deficit to an economic expansion; surprisingly, Lebanon has been suffering from historically large trade deficits under continuing distressed economic situation.
Nevertheless, the collapse of the economy, particularly between years 2019 and 2021, has narrowed the Lebanese trade deficit as most of citizens struggled to afford basic needs. In details, Lebanon’s trade deficit tightened from $17.02B in 2018 to $15.50B in 2019 down to $7.75B in 2020. Crucially, however, the 2021’s and 2022’s trade deficits have gradually increased compared to years before and readjusted to levels used to be in 2019 to stand at $9.75B in 2021 and $15.55B in 2022. Several reasons drove the downtrend, most likely: the sharp deterioration of the national currency, interruption of major conduits for trade and relations with Gulf and neighboring countries, and most importantly insecurity that hampers regional trade. Despite this higher deficit in trade balance in 2022, the balance of payment deficit was only $3.2B by November 2022 which indicates that the trade deficit has been financed from the market.
Focusing on the substantial increase in 2022’ trade deficit, it is remarkably noticeable that imports’ levels have jumped from $11.31B in 2020 and $13.64B in 2021 to $19.04 by the end of 2022, close to the 2019’ total imports that amounted to $19.24B. In fact, selected import products are keys for 2022 exports enlargement; and fuel imports have typically been a crucial product for Lebanon, while tourism sector improvement and readjustment of Lebanese purchasing power during 2022 contributed to the two-digit trade deficit in 2022.
Top four imported products that grasped the biggest shares of total importation for year of 2022 were “Mineral fuels, mineral oils and products of their” with a stake of 28.64%, “Vehicles other than railway or tramway” with a share of 9.81%. “Natural or cultured pearls, precious or semi-precious” stood at 8.83%, while “Electrical machinery and equipment and parts” took the share of 8.59%.
In more details, “mineral fuels, mineral oils and products of their” recorded a 44.16% more expensive import bill in 2022, from $3.79B in 2021 to $5.46B in 2022. However, in term of weights and quantities, Lebanon imported 16.96% less mineral fuels and oils in 2022 that totaled 5,140,989 tons compared to 6,191,191 tons in 2021 and 7,801,975 tons in 2020 and a high of 11,795,218 tons in 2019. It is obvious to observe the downtrend of fuel importation in term of weights in 2019 and 2021 while lockdowns were imposed during the pandemic, as the Lebanese economy contracted the most and global crude oil prices dropped to the lowest levels during peaks of Covid19. Hence, in 2022, value increased as average crude oil prices jumped from $41.47/barrels in 2020 and $68.17/barrels in 2021 to a high of $94.53/barrels in 2022. But the reduction in tonnage, besides the higher prices, could be due to reduced smuggling to Syria as subsidies on fuel were removed by BDL in September 2021.
Mineral Fuels and Mineral oils importation in Billions of USD and millions of tons
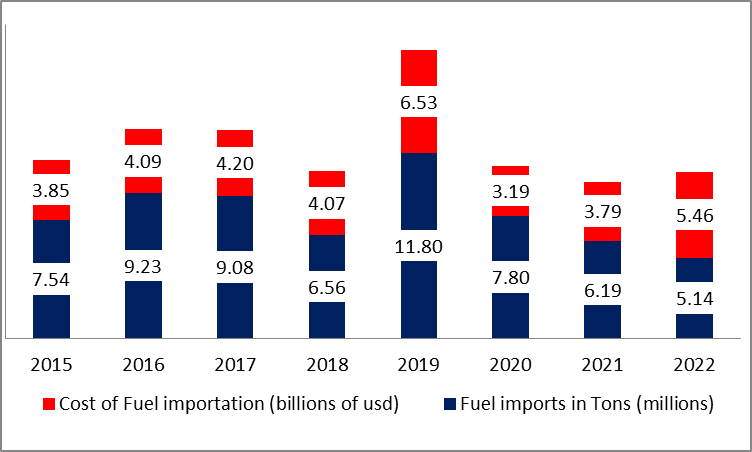
Source: Customs Administration, BLOMINVEST
Looking onto “Vehicles other than railway or tramway” importation bills, it witnessed a remarkable and fast deterioration for the past 5 years from a high of $1.83B in 2017 to $1.60B in 2018 and $1.11B in 2019 and a low of $431.29M in 2020. The drop in Vehicles importation could be attributed to the decreased number of loans and facilities granted by banks for individuals as well as to a weaker private consumption, not to mention the rapid deterioration of the economic situation in the country and the pandemic later. However, the trend reversed gradually during 2021 and continued during 2022 to register a 75.4% yearly increase by the end of 2022 totaled $1.86B. The breakdown of Customs data revealed that the first half of the year had the largest vehicles importations with July holding the largest monthly imported vehicles totaled $211.47M while the numbers dropped to end the year with a 67.60% decrease on a monthly basis by December. The reason behind this uptrend could be the market reaction towards the awaited announcement of the Ministry of Finance regarding the adjustment of the foreign exchange rates on taxes and fees collected by the Customs Administration on imported goods and merchandise, on the basis of LBP 15,000 per US dollar.
Furthermore, “Natural or cultured pearls, precious of semi-precious” witnessed an important increase by 35.83% in term of values and 75.90% in term of quantity by the end of 2022 after 2 years of suffering despite worldwide prices hit the highest levels. Moreover, “Electrical machinery and equipment” observed a remarkable upsurge of 160.80% in term of value and almost 173.50% in term of quantity to stand at $1.63B for 253.6M tons against $627.65M for only 92.7M tons in 2021. The increase and numbers were the highest during the last 7 years and it certainly attributed to the suppliers’ intention to hoard stocks before the application of the customs rate of 15,000 LBP/USD on imported products.
Cost of imported Vehicles, Natural or cultured pearls and precious or semi-precious, Electrical machinery and equipment (2015:2022) in Billions of USD:
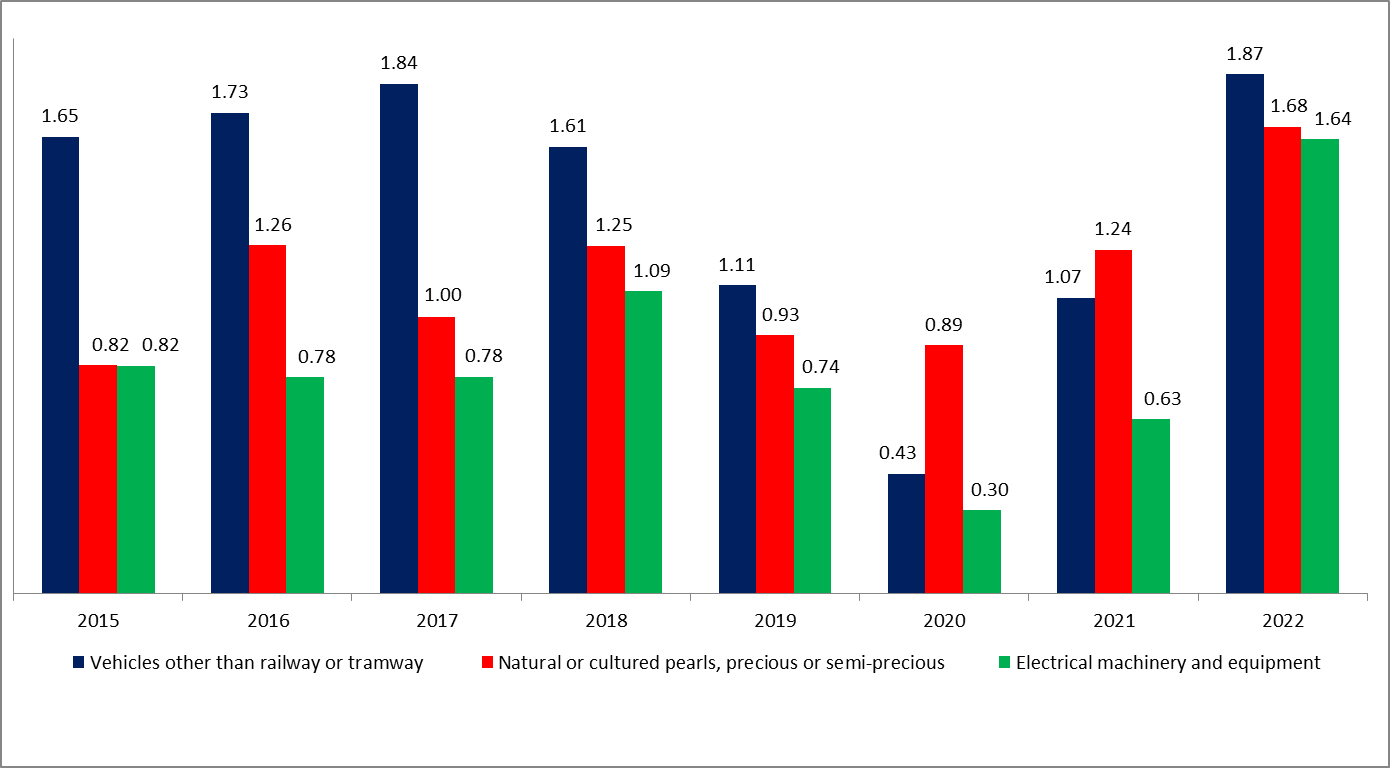
Source: Customs Administration, BLOMINVEST
Overall, Lebanon’s lack of value added, and large export led industries hold back a growth in exports that would remarkably narrow the deficit. Lebanon’s large external imbalances will definitely take time to improve given the current economic structure. Hence, despite the relative diversification of export goods, exportation in general remains feeble which indicates a failing and underdeveloped economy that revolves around the service sector. Private consumption is a key in Lebanon’s growth driver and a major reason for imports consistently exceeding exports, while Lebanese leaders failed to improve public expenditures and implement a reasonable budget. In this context, it is important to highlight the recommendations presented by the IMF’s January 2023 report on Lebanon regarding the utilization of the market exchange rate in the entire tax system instead of using the 15,000 LBP exchange rates. The report revealed that “adopting a lower rate than the Sayrafa at least or any preset value in absolute amount for tax purposed is highly recommended against, in the strongest possible terms. Reiterating, using the market exchange rate is a correction of the current improper valuation practice.”
Consequently, Lebanon received a moderate score of 49.6 out of 100 on Trade and Investment Risk Index conducted by Fitch Solution, which ranks it in the 11th place out of 18 MENA markets and 95th out of 201 markets globally. Weak domestic manufacturing sector and a total reliance on imported goods and fuel will certainly keep the trade deficit wider; and without structural reforms, greater political stability and improvement in regional security, Lebanon will continue to suffer, and investor’s confidence will remain weak.