
Discover today’s performance of BLOM indices, the closing prices of Lebanese stocks and Eurobonds, as well as the exchange rate of major currencies against the LBP.
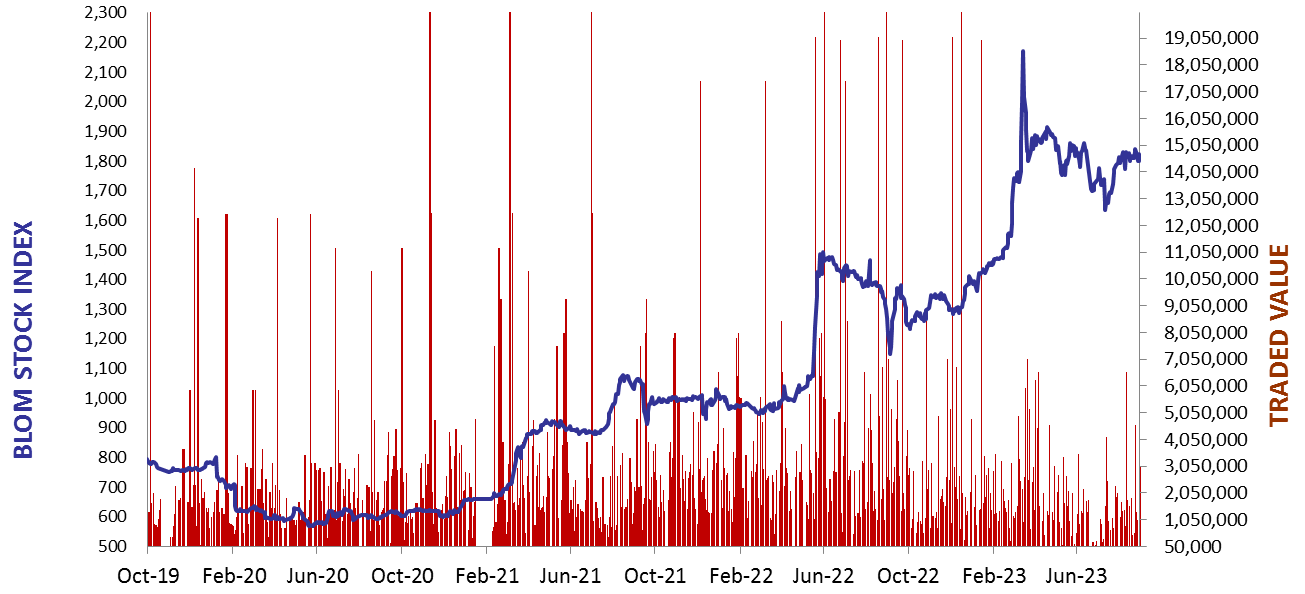
BLOM Stock Index (BSI) – today’s performance
| Last | Previous | % Change | Y-t-D Change | |
| BSI | 1,822.22 | 1,793.07 | 1.63% | 31.67% |
| High | 1,834.42 | 1,824.22 | ||
| Low | 1,793.07 | 1,784.17 | ||
| Volume | 7,847 | 9,649 | ||
| Val ($) | 613,003 | 729,654 |
I): BLOM preferred Shares Index (BPSI): today’s Performance
| Last | Previous | Change | |
| BPSI | 39.62 | 39.62 | 0.00% |
| Volume | |||
| Value |
Lebanese Stocks: today’s Trades and Closing Prices
| Last Price ($) | % Change | Volume | VWAP ($) | |
| Solidere A | 78.5 | 1.03% | 5,661 | 78.5 |
| Solidere B | 78 | 4.49% | 1,982 | 77.98 |
| HOLCIM | 69 | 0.07% | 204 | 69 |
Closing Date: September 4, 2023
The BLOM Stock Index
| Last | Previous | Change | Y-t-D Change | ||
| BBI | 7.59 | 7.59 | -0.10% | 25.81% | |
| Weighted Yield | 155.97% | 155.80% | 16 | bps | |
| Duration (Years) | 1.50 | 1.50 | |||
| 5Y Bond Yield | 130.70% | 130.50% | 20 | bps | |
| 5Y Spread* | 12,534 | 12,513 | 21 | bps | |
| 10Y Bond Yield | 91.25% | 91.30% | -5 | bps | |
| 10Y Spread* | 8,668 | 8,676 | -8 | bps |
BLOM BOND INDEX: Last Session’s Performance
| Price | Yield | Yield Change | |
| 04/11/2024 | 7.80 | 425.73% | 123 |
| 03/12/2024 | 7.77 | 391.90% | (6) |
| 26/02/2025 | 7.77 | 316.41% | 98 |
| 12/06/2025 | 7.96 | 243.97% | (2) |
| 28/11/2026 | 7.80 | 137.38% | 4 |
| 23/03/2027 | 7.78 | 130.70% | 11 |
| 29/11/2027 | 7.75 | 114.20% | 35 |
| 03/11/2028 | 7.81 | 100.83% | (5) |
| 26/02/2030 | 7.87 | 92.29% | (23) |
| 22/04/2031 | 7.79 | 91.65% | 8 |
| 23/03/2032 | 7.73 | 91.41% | (9) |
| 02/11/2035 | 7.82 | 88.67% | 40 |
| 23/03/2037 | 7.88 | 91.18% | 0 |
*spread between Lebanese Eurobonds and US Treasuries
Closing Date: September 1, 2023
Lebanese Forex Market
| Last Price | Previous | % Change | |
| $/LBP | 15,000 | 15,000 | – |
| €/LBP | 16,204.50 | 16,170.00 | 0.21% |
| £/LBP | 18,939.00 | 18,885.00 | 0.29% |
| NEER | 237.14 | 236.99 | 0.06% |
Closing Date: September 04, 2023