
Discover today’s performance of BLOM indices, the closing prices of Lebanese stocks and Eurobonds, as well as the exchange rate of major currencies against the LBP.
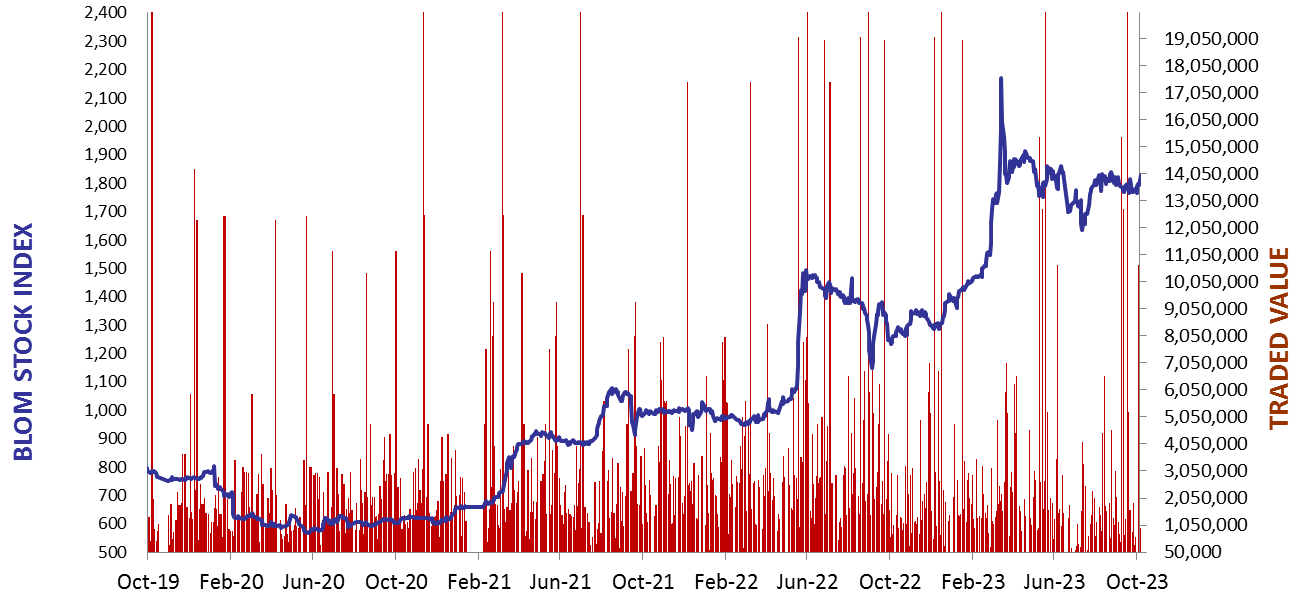
BLOM Stock Index (BSI) – today’s performance
| Last | Previous | % Change | Y-t-D Change | |
| BSI | 1,763.82 | 1,776.60 | -0.72% | 27.45% |
| High | 1,776.60 | 1,798.50 | ||
| Low | 1,755.37 | 1,744.16 | ||
| Volume | 15,969 | 4,800 | ||
| Val ($) | 1,197,778 | 364,567 |
I): BLOM preferred Shares Index (BPSI): today’s Performance
| Last | Previous | Change | |
| BPSI | 39.62 | 39.62 | 0.00% |
| Volume | |||
| Value |
Lebanese Stocks: today’s Trades and Closing Prices
| Last Price ($) | % Change | Volume | VWAP ($) | |
| Solidere A | 74.65 | -0.53% | 9,511 | 74.95 |
| Solidere B | 75.2 | -1.83% | 6,458 | 75.09 |
Closing Date: October 16, 2023
The BLOM Stock Index
| Last | Previous | Change | Y-t-D Change | ||
| BBI | 6.43 | 6.75 | -4.81% | 6.56% | |
| Weighted Yield | 185.87% | 179.44% | 642 | bps | |
| Duration (Years) | 1.36 | 1.41 | |||
| 5Y Bond Yield | 149.00% | 143.50% | 550 | bps | |
| 5Y Spread* | 14,359 | 13,807 | 552 | bps | |
| 10Y Bond Yield | 107.30% | 100.50% | 680 | bps | |
| 10Y Spread* | 10,250 | 9,568 | 682 | bps |
BLOM BOND INDEX: Last Session’s Performance
| Price | Yield | Yield Change | |
| 04/11/2024 | 6.61 | 566.49% | 2,067 |
| 03/12/2024 | 6.65 | 498.37% | 1,212 |
| 26/02/2025 | 6.62 | 381.80% | 1,676 |
| 12/06/2025 | 7.09 | 283.17% | 418 |
| 28/11/2026 | 6.57 | 157.14% | 349 |
| 23/03/2027 | 6.57 | 149.06% | 556 |
| 29/11/2027 | 6.59 | 129.37% | 280 |
| 03/11/2028 | 6.62 | 115.48% | 398 |
| 26/02/2030 | 6.55 | 106.08% | 439 |
| 22/04/2031 | 6.61 | 107.63% | 553 |
| 23/03/2032 | 6.51 | 107.42% | 685 |
| 02/11/2035 | 6.61 | 105.57% | 539 |
| 23/03/2037 | 6.57 | 109.09% | 492 |
*spread between Lebanese Eurobonds and US Treasuries
Closing Date: October 13, 2023
Lebanese Forex Market
| Last Price | Previous | % Change | |
| $/LBP | 15,000 | 15,000 | – |
| €/LBP | 15,810.00 | 15,765.00 | 0.29% |
| £/LBP | 18,237.00 | 18,214.50 | 0.12% |
| NEER | 239.59 | 239.45 | 0.06% |
Closing Date: October 16, 2023