
Discover today’s performance of BLOM indices, the closing prices of Lebanese stocks and Eurobonds, as well as the exchange rate of major currencies against the LBP.
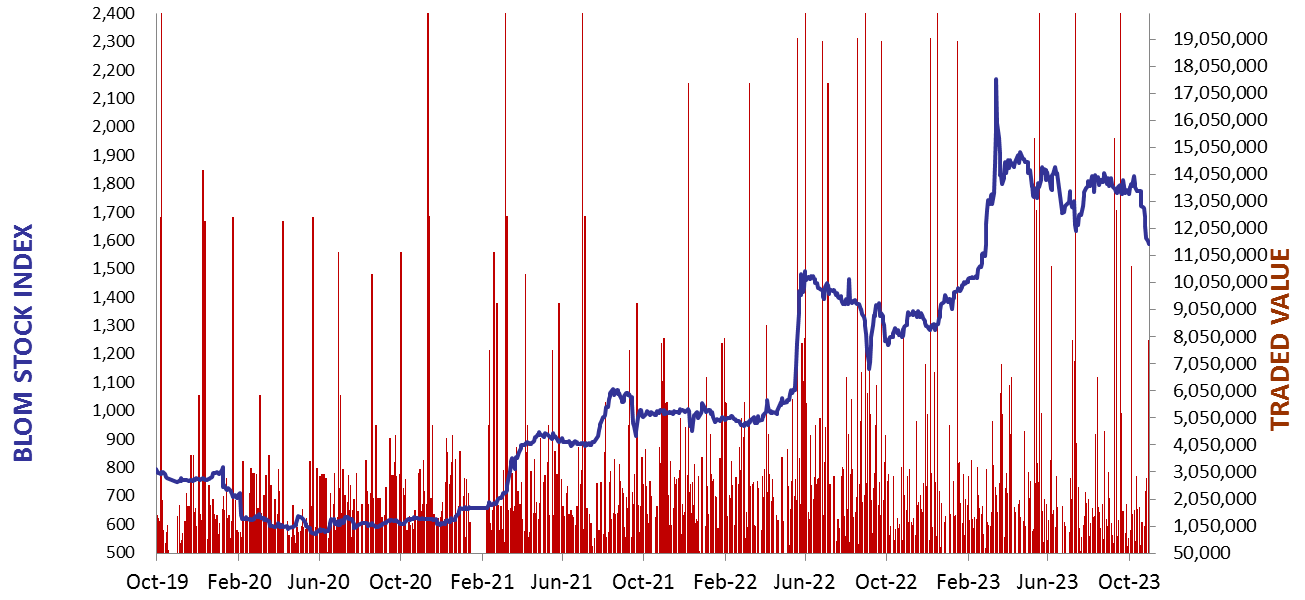
BLOM Stock Index (BSI) – today’s performance
| Last | Previous | % Change | Y-t-D Change | |
| BSI | 1,580.08 | 1,580.08 | 0.00% | 14.17% |
| High | 1,580.08 | 1,588.64 | ||
| Low | 1,580.08 | 1,580.08 | ||
| Volume | 0 | 3,065 | ||
| Val ($) | 0 | 202,290 |
I): BLOM preferred Shares Index (BPSI): today’s Performance
| Last | Previous | Change | |
| BPSI | 39.62 | 39.62 | 0.00% |
| Volume | |||
| Value |
Lebanese Stocks: today’s Trades and Closing Prices
Closing Date: November 3, 2023
The BLOM Stock Index
| Last | Previous | Change | Y-t-D Change | ||
| BBI | 6.00 | 5.97 | 0.44% | -0.57% | |
| Weighted Yield | 202.91% | 202.78% | 13 | bps | |
| Duration (Years) | 1.28 | 1.25 | |||
| 5Y Bond Yield | 156.70% | 156.40% | 30 | bps | |
| 5Y Spread* | 15,132 | 15,103 | 29 | bps | |
| 10Y Bond Yield | 111.50% | 112.80% | -130 | bps | |
| 10Y Spread* | 10,672 | 10,804 | -132 | bps |
BLOM BOND INDEX: Last Session’s Performance
| Price | Yield | Yield Change | |
| 04/11/2024 | 6.14 | 663.69% | 158 |
| 03/12/2024 | 6.10 | 572.22% | 376 |
| 26/02/2025 | 6.05 | 422.33% | 531 |
| 12/06/2025 | 6.29 | 317.05% | 129 |
| 28/11/2026 | 6.14 | 166.82% | (79) |
| 23/03/2027 | 6.08 | 157.10% | 61 |
| 29/11/2027 | 6.22 | 136.11% | (70) |
| 03/11/2028 | 6.19 | 122.90% | (90) |
| 26/02/2030 | 6.20 | 110.76% | (34) |
| 22/04/2031 | 6.21 | 113.98% | (120) |
| 23/03/2032 | 6.22 | 111.26% | (130) |
| 02/11/2035 | 6.25 | 112.91% | (160) |
| 23/03/2037 | 6.20 | 114.42% | (118) |
*spread between Lebanese Eurobonds and US Treasuries
Closing Date: November 2, 2023
Lebanese Forex Market
| Last Price | Previous | % Change | |
| $/LBP | 15,000 | 15,000 | – |
| €/LBP | 15,942.00 | 15,933.00 | 0.06% |
| £/LBP | 18,301.50 | 18,304.50 | -0.02% |
| NEER | 239.99 | 240.00 | 0.00% |
Closing Date: November 3, 2023