
Discover today’s performance of BLOM indices, the closing prices of Lebanese stocks and Eurobonds, as well as the exchange rate of major currencies against the LBP.
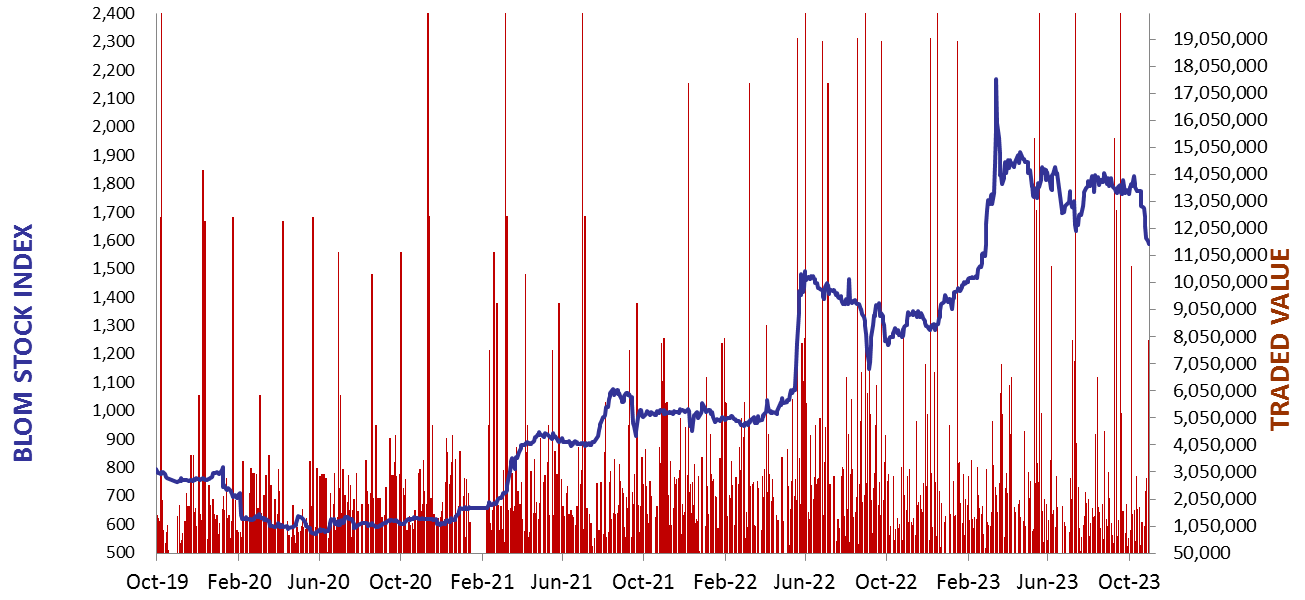
BLOM Stock Index (BSI) – today’s performance
| Last | Previous | % Change | Y-t-D Change | |
| BSI | 1,620.62 | 1,603.13 | 1.09% | 17.10% |
| High | 1,620.62 | 1,606.47 | ||
| Low | 1,603.13 | 1,575.50 | ||
| Volume | 12,440 | 5,814 | ||
| Val ($) | 857,029 | 392,885 |
I): BLOM preferred Shares Index (BPSI): today’s Performance
| Last | Previous | Change | |
| BPSI | 39.62 | 39.62 | 0.00% |
| Volume | |||
| Value |
Lebanese Stocks: today’s Trades and Closing Prices
| Last Price ($) | % Change | Volume | VWAP ($) | |
| Solidere A | 69.95 | 2.19% | 9,530 | 69.78 |
| Solidere B | 66 | 0.69% | 2,910 | 66 |
Closing Date: November 7, 2023
The BLOM Stock Index
| Last | Previous | Change | Y-t-D Change | ||
| BBI | 6.00 | 5.97 | 0.53% | -0.45% | |
| Weighted Yield | 204.16% | 203.86% | 29 | bps | |
| Duration (Years) | 1.31 | 1.31 | |||
| 5Y Bond Yield | 156.05% | 156.65% | -60 | bps | |
| 5Y Spread* | 15,072 | 15,136 | -64 | bps | |
| 10Y Bond Yield | 112.15% | 112.95% | -80 | bps | |
| 10Y Spread* | 10,743 | 10,833 | -90 | bps |
BLOM BOND INDEX: Last Session’s Performance
| Price | Yield | Yield Change | |
| 04/11/2024 | 6.16 | 675.85% | 449 |
| 03/12/2024 | 6.10 | 583.37% | 663 |
| 26/02/2025 | 6.16 | 422.43% | 102 |
| 12/06/2025 | 6.30 | 320.17% | 141 |
| 28/11/2026 | 6.16 | 167.17% | (17) |
| 23/03/2027 | 6.16 | 156.02% | (58) |
| 29/11/2027 | 6.16 | 137.50% | 41 |
| 03/11/2028 | 6.14 | 123.61% | (48) |
| 26/02/2030 | 6.22 | 110.36% | (22) |
| 22/04/2031 | 6.18 | 114.36% | (82) |
| 23/03/2032 | 6.16 | 112.10% | (43) |
| 02/11/2035 | 6.17 | 114.06% | (100) |
| 23/03/2037 | 6.21 | 114.23% | (38) |
*spread between Lebanese Eurobonds and US Treasuries
Closing Date: November 6, 2023
Lebanese Forex Market
| Last Price | Previous | % Change | |
| $/LBP | 15,000 | 15,000 | – |
| €/LBP | 16,051.50 | 16,072.50 | -0.13% |
| £/LBP | 18,487.50 | 18,511.50 | -0.13% |
| NEER | 239.90 | 239.73 | 0.07% |
Closing Date: November 7, 2023