
Discover today’s performance of BLOM indices, the closing prices of Lebanese stocks and Eurobonds, as well as the exchange rate of major currencies against the LBP.
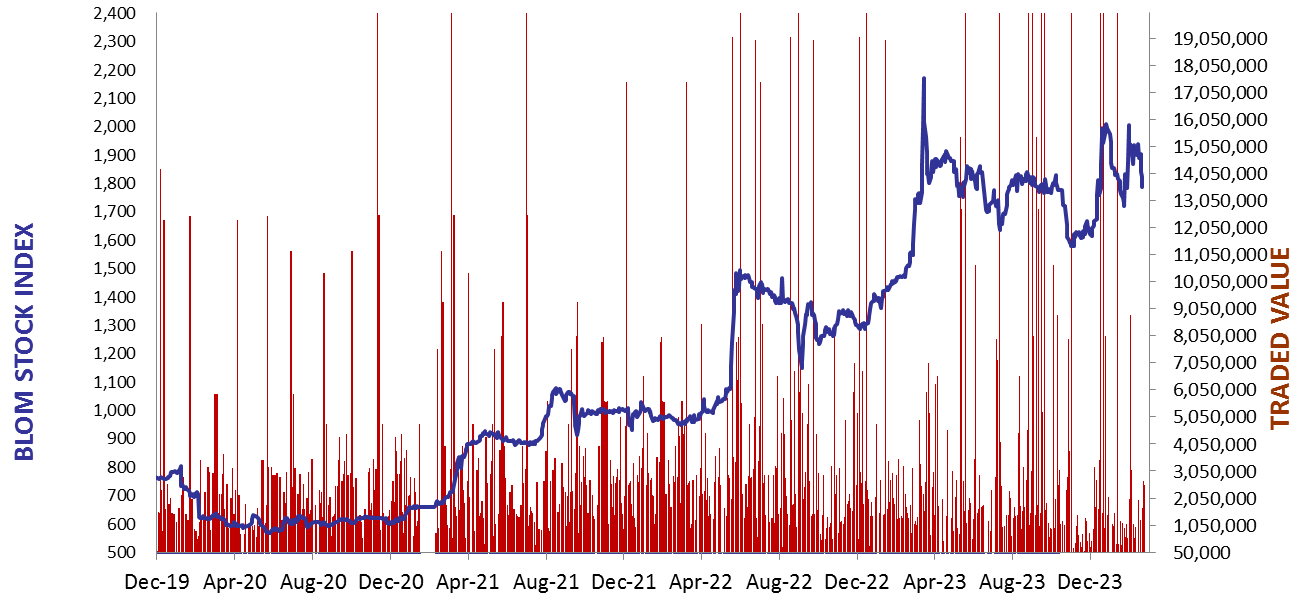
BLOM Stock Index (BSI) – today’s performance
| Last | Previous | % Change | Y-t-D Change | |
| BSI | 1,760.83 | 1,786.46 | -1.43% | -10.75% |
| High | 1,824.19 | 1,822.90 | ||
| Low | 1,668.72 | 1,786.46 | ||
| Volume | 15,643 | 16,852 | ||
| Val ($) | 798,950 | 504,233 |
I): BLOM preferred Shares Index (BPSI): today’s Performance
| Last | Previous | Change | |
| BPSI | 39.62 | 39.62 | 0.00% |
| Volume | |||
| Value |
Lebanese Stocks: today’s Trades and Closing Prices
| Last Price ($) | % Change | Volume | VWAP ($) | |
| Solidere A | 75.35 | -1.31% | 3,864 | 74.77 |
| Solidere B | 76.2 | -3.61% | 6,779 | 74.7 |
| Byblos Bank | 0.73 | 5.80% | 5,000 | 0.7 |
Closing Date: February 23, 2024
The BLOM Stock Index
BLOM BOND INDEX: Last Session’s Performance
| Last | Previous | Change | Y-t-D Change | ||
| BBI | 5.11 | 5.11 | 0.07% | -15.25% | |
| Weighted Yield | 214.54% | 213.98% | 57 | bps | |
| Duration (Years) | 1.12 | 1.12 | |||
| 5Y Bond Yield | 123.70% | 123.20% | 50 | bps | |
| 5Y Spread* | 11,868 | 11,822 | 46 | bps | |
| 10Y Bond Yield | 122.40% | 122.20% | 20 | bps | |
| 10Y Spread* | 11,791 | 11,777 | 14 | bps |
*spread between Lebanese Eurobonds and US Treasuries
| Price | Yield | Yield Change | |
| 26/02/2025 | 5.58 | 697.84% | 617 |
| 12/06/2025 | 5.84 | 435.92% | 119 |
| 28/11/2026 | 5.64 | 189.22% | 19 |
| 23/03/2027 | 5.66 | 176.45% | (49) |
| 29/11/2027 | 5.64 | 150.61% | 4 |
| 03/11/2028 | 5.63 | 132.22% | 28 |
| 26/02/2030 | 5.65 | 123.72% | 1 |
| 22/04/2031 | 5.64 | 122.22% | 15 |
| 23/03/2032 | 5.64 | 122.39% | 8 |
| 02/11/2035 | 5.69 | 119.84% | (94) |
| 23/03/2037 | 5.64 | 125.61% | 43 |
Closing Date: February 22, 2024
Lebanese Forex Market
| Last Price | Previous | % Change | |
| $/LBP | 15,000 | 15,000 | – |
| €/LBP | 16,243.50 | 16,234.50 | 0.06% |
| £/LBP | 18,999.00 | 18,990.00 | 0.05% |
| NEER | 239.40 | 239.18 | 0.09% |
Closing Date: February 23, 2024