
Discover today’s performance of BLOM indices, the closing prices of Lebanese stocks and Eurobonds, as well as the exchange rate of major currencies against the LBP.
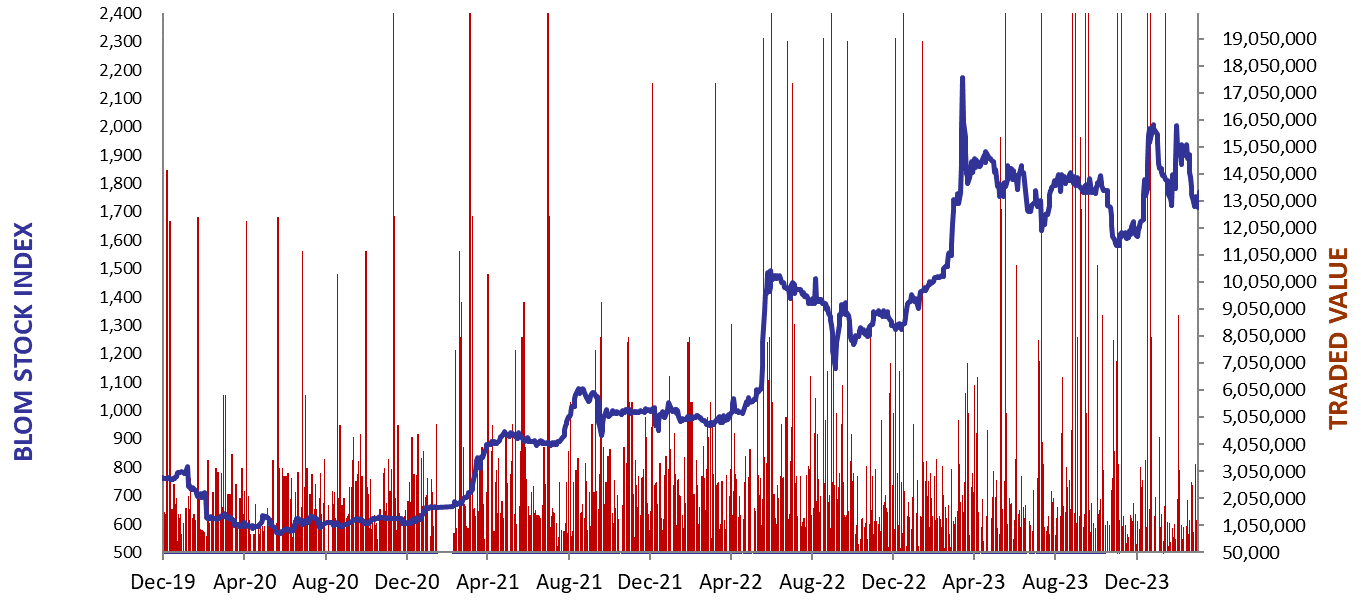
BLOM Stock Index (BSI) – today’s performance
| Last | Previous | % Change | Y-t-D Change | |
| BSI | 1,623.48 | 1,627.84 | -0.27% | -17.71% |
| High | 1,742.27 | 1,742.50 | ||
| Low | 1,622.60 | 1,627.60 | ||
| Volume | 10,827 | 5,658 | ||
| Val ($) | 468,221 | 215,654 |
I): BLOM preferred Shares Index (BPSI): today’s Performance
| Last | Previous | Change | |
| BPSI | 35.15 | 35.15 | 0.00% |
| Volume | |||
| Value |
Lebanese Stocks: today’s Trades and Closing Prices
| Last Price ($) | % Change | Volume | VWAP ($) | |
| Solidere A | 70 | -1.62% | 6,544 | 70.03 |
| Solidere B | 67 | -7.52% | 114 | 67 |
| Byblos Bank – Listed Shares | 0.55 | 5.77% | 4,169 | 0.6 |
Closing Date: May 07, 2024
The BLOM Stock Index
BLOM BOND INDEX: Last Session’s Performance
| Last | Previous | Change | Y-t-D Change | ||
| BBI | 5.78 | 5.81 | -0.41% | -4.08% | |
| Weighted Yield | 230.91% | 228.91% | 200 | bps | |
| Duration (Years) | 1.31 | 1.29 | |||
| 5Y Bond Yield | 110.80% | 110.35% | 45 | bps | |
| 5Y Spread* | 10,564 | 10,510 | 54 | bps | |
| 10Y Bond Yield | 109.75% | 109.50% | 25 | bps | |
| 10Y Spread* | 10,504 | 10,463 | 41 | bps |
*spread between Lebanese Eurobonds and US Treasuries
| Price | Yield | Yield Change | |
| 26/02/2025 | 6.39 | 890.02% | 1,104 |
| 12/06/2025 | 6.49 | 523.39% | 893 |
| 28/11/2026 | 6.29 | 192.47% | 105 |
| 23/03/2027 | 6.36 | 173.70% | 27 |
| 29/11/2027 | 6.43 | 145.49% | 105 |
| 03/11/2028 | 6.39 | 126.57% | 41 |
| 26/02/2030 | 6.44 | 110.25% | 59 |
| 22/04/2031 | 6.42 | 111.72% | (1) |
| 23/03/2032 | 6.42 | 108.63% | 25 |
| 02/11/2035 | 6.42 | 109.88% | 26 |
| 23/03/2037 | 6.49 | 109.50% | (57) |
Closing Date: May 02, 2024
Lebanese Forex Market
| Last Price | Previous | % Change | |
| $/LBP | 89,500 | 89,500 | – |
| €/LBP | 96,257.25 | 95,988.75 | 0.28% |
| £/LBP | 111,955.55 | 112,179.30 | -0.20% |
| NEER | 227.24 | 227.47 | -0.10% |
Closing Date: May 07, 2024