
Discover today’s performance of BLOM indices, the closing prices of Lebanese stocks and Eurobonds, as well as the exchange rate of major currencies against the LBP.
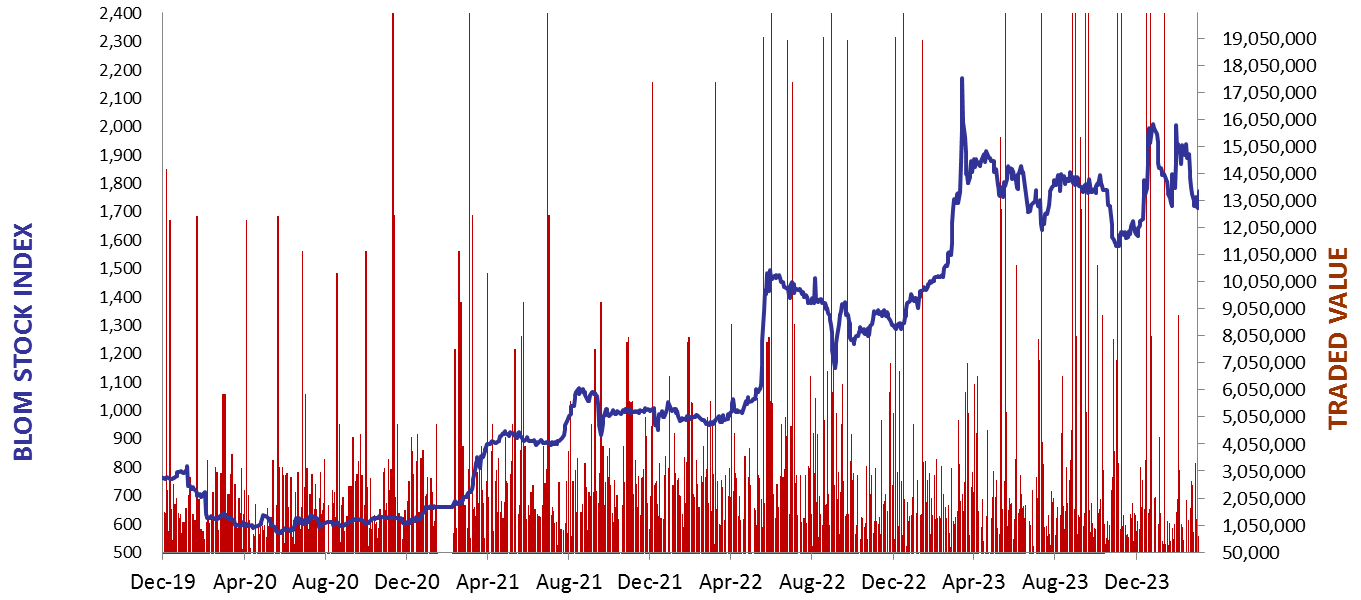
BLOM Stock Index (BSI) – today’s performance
| Last | Previous | % Change | Y-t-D Change | |
| BSI | 1,616.75 | 1,623.48 | -0.41% | -18.06% |
| High | 1,742.27 | 1,742.27 | ||
| Low | 1,616.50 | 1,622.60 | ||
| Volume | 560 | 10,827 | ||
| Val ($) | 33,891 | 468,221 |
I): BLOM preferred Shares Index (BPSI): today’s Performance
| Last | Previous | Change | |
| BPSI | 35.15 | 35.15 | 0.00% |
| Volume | |||
| Value |
Lebanese Stocks: today’s Trades and Closing Prices
| Last Price ($) | % Change | Volume | VWAP ($) | |
| Solidere A | 70 | 0.00% | 200 | 70 |
| Solidere B | 66.2 | -1.19% | 300 | 66.2 |
| Byblos Bank – Listed Shares | 0.52 | -5.45% | 60 | 0.5 |
Closing Date: May 08, 2024
The BLOM Stock Index
BLOM BOND INDEX: Last Session’s Performance
| Last | Previous | Change | Y-t-D Change | ||
| BBI | 5.84 | 5.78 | 0.88% | -3.23% | |
| Weighted Yield | 232.80% | 230.91% | 189 | bps | |
| Duration (Years) | 1.33 | 1.31 | |||
| 5Y Bond Yield | 109.95% | 110.80% | -85 | bps | |
| 5Y Spread* | 10,482 | 10,564 | -82 | bps | |
| 10Y Bond Yield | 108.50% | 109.75% | -125 | bps | |
| 10Y Spread* | 10,390 | 10,504 | -114 | bps |
*spread between Lebanese Eurobonds and US Treasuries
| Price | Yield | Yield Change | |
| 26/02/2025 | 6.44 | 911.96% | 2,194 |
| 12/06/2025 | 6.61 | 529.38% | 599 |
| 28/11/2026 | 6.34 | 193.08% | 60 |
| 23/03/2027 | 6.39 | 173.63% | (8) |
| 29/11/2027 | 6.49 | 145.37% | (12) |
| 03/11/2028 | 6.44 | 126.06% | (51) |
| 26/02/2030 | 6.50 | 109.41% | (84) |
| 22/04/2031 | 6.48 | 110.55% | (117) |
| 23/03/2032 | 6.48 | 107.55% | (108) |
| 02/11/2035 | 6.48 | 108.56% | (132) |
| 23/03/2037 | 6.53 | 108.76% | (74) |
Closing Date: May 07, 2024
Lebanese Forex Market
| Last Price | Previous | % Change | |
| $/LBP | 89,500 | 89,500 | – |
| €/LBP | 96,131.95 | 96,257.25 | -0.13% |
| £/LBP | 111,767.60 | 111,955.55 | -0.17% |
| NEER | 227.28 | 227.24 | 0.02% |
Closing Date: May 08, 2024