
Discover today’s performance of BLOM indices, the closing prices of Lebanese stocks and Eurobonds, as well as the exchange rate of major currencies against the LBP.
BLOM Stock Index (BSI) – today’s performance
| Last | Previous | % Change | Y-t-D Change | |
| BSI | 1,634.50 | 1,634.50 | 0.00% | -17.16% |
| High | 1,634.50 | 1,634.50 | ||
| Low | 1,634.50 | 1,616.50 | ||
| Volume | 1,130 | 13,026 | ||
| Val ($) | 78,100 | 654,602 |
I): BLOM preferred Shares Index (BPSI): today’s Performance
| Last | Previous | Change | |
| BPSI | 35.15 | 35.15 | 0.00% |
| Volume | |||
| Value |
Lebanese Stocks: today’s Trades and Closing Prices
| Last Price ($) | % Change | Volume | VWAP ($) | |
| Solidere A | 70 | 0.00% | 130 | 70 |
| Solidere B | 69 | 0.00% | 1,000 | 69 |
Closing Date: May 10, 2024
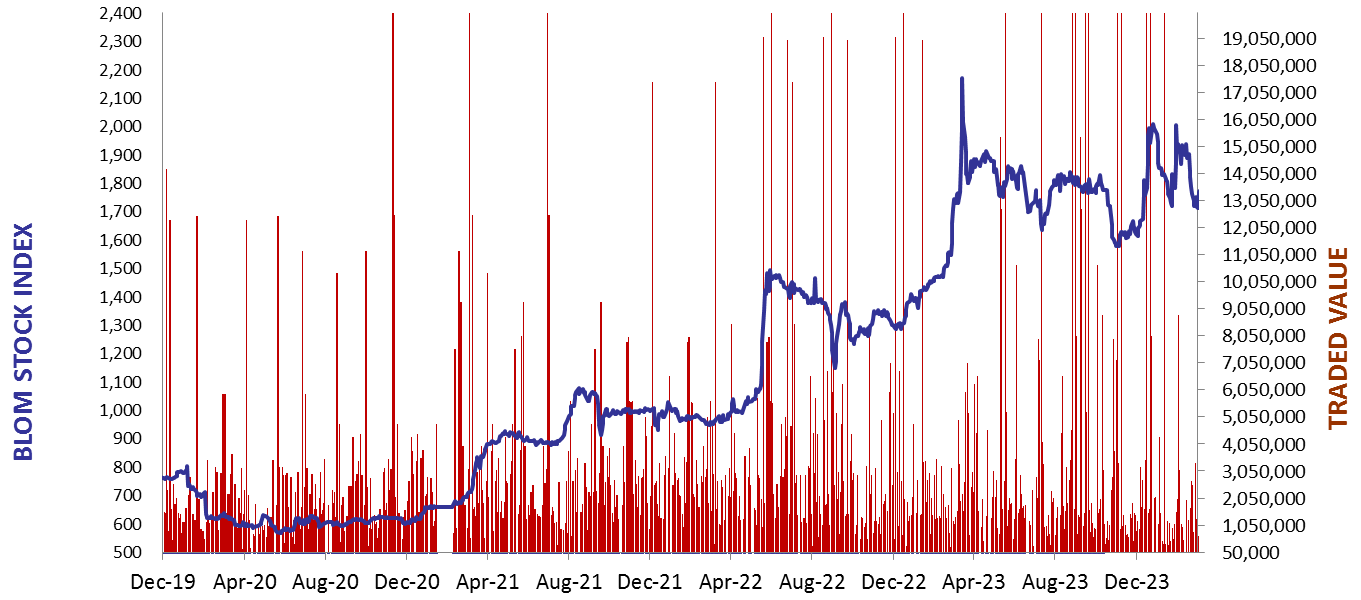
The BLOM Stock Index
BLOM BOND INDEX: Last Session’s Performance
| Last | Previous | Change | Y-t-D Change | ||
| BBI | 5.86 | 5.83 | 0.42% | -2.90% | |
| Weighted Yield | 233.37% | 233.55% | -19 | bps | |
| Duration (Years) | 1.33 | 1.33 | |||
| 5Y Bond Yield | 110.50% | 110.00% | 50 | bps | |
| 5Y Spread* | 10,538 | 10,487 | 51 | bps | |
| 10Y Bond Yield | 108.40% | 108.85% | -45 | bps | |
| 10Y Spread* | 10,380 | 10,422 | -42 | bps |
*spread between Lebanese Eurobonds and US Treasuries
| Price | Yield | Yield Change | |
| 26/02/2025 | 6.49 | 917.59% | 45 |
| 12/06/2025 | 6.65 | 532.01% | 19 |
| 28/11/2026 | 6.38 | 192.99% | (39) |
| 23/03/2027 | 6.44 | 173.10% | (61) |
| 29/11/2027 | 6.50 | 145.42% | (1) |
| 03/11/2028 | 6.50 | 125.22% | (79) |
| 26/02/2030 | 6.50 | 109.42% | 1 |
| 22/04/2031 | 6.43 | 111.28% | 35 |
| 23/03/2032 | 6.50 | 107.19% | (76) |
| 02/11/2035 | 6.43 | 109.29% | 37 |
| 23/03/2037 | 6.53 | 108.64% | (21) |
Closing Date: May 09, 2024
Lebanese Forex Market
| Last Price | Previous | % Change | |
| $/LBP | 89,500 | 89,500 | – |
| €/LBP | 96,436.25 | 96,489.95 | -0.06% |
| £/LBP | 112,027.15 | 112,071.90 | -0.04% |
| NEER | 227.39 | 227.34 | 0.02% |
Closing Date: May 10, 2024