
Discover today’s performance of BLOM indices, the closing prices of Lebanese stocks and Eurobonds, as well as the exchange rate of major currencies against the LBP.
BLOM Stock Index (BSI): Today’s Performance
| Last | Previous | % Change | Y-t-D Change | |
| BSI | 1,151.67 | 1,156.60 | -0.43% | -5.03% |
| High | 1,154.54 | 1,158.39 | ||
| Low | 1,151.67 | 1,153.62 | ||
| Volume | 215,247.00 | 129,469.00 | 66.25% | |
| Val ($) | 1,965,613.00 | 1,061,462.00 | 85.18% |
BLOM Preferred Shares Index (BPSI): Today’s Performance
| Last | Previous | Change | |
| BPSI | 104.75 | 104.75 | 0.00% |
| Volume | 22,650 | – | |
| Value | 571,913 | – |
Lebanese Stocks: Today’s Trades and Closing Prices
| Last Price ($) | % Change | Volume | VWAP ($) | |
| Solidere A | 7.79 | -3.95% | 99,647.00 | 7.9 |
| Solidere B | 7.96 | 0.38% | 24,731.00 | 7.94 |
| Bank of Beirut Pref I | 25.25 | 0.00% | 22,650.00 | 25.25 |
| Byblos Bank Listed | 1.61 | -0.62% | 40,000.00 | 1.61 |
| BLOM Bank GDR | 12.23 | -0.57% | 28,219.00 | 12.25 |
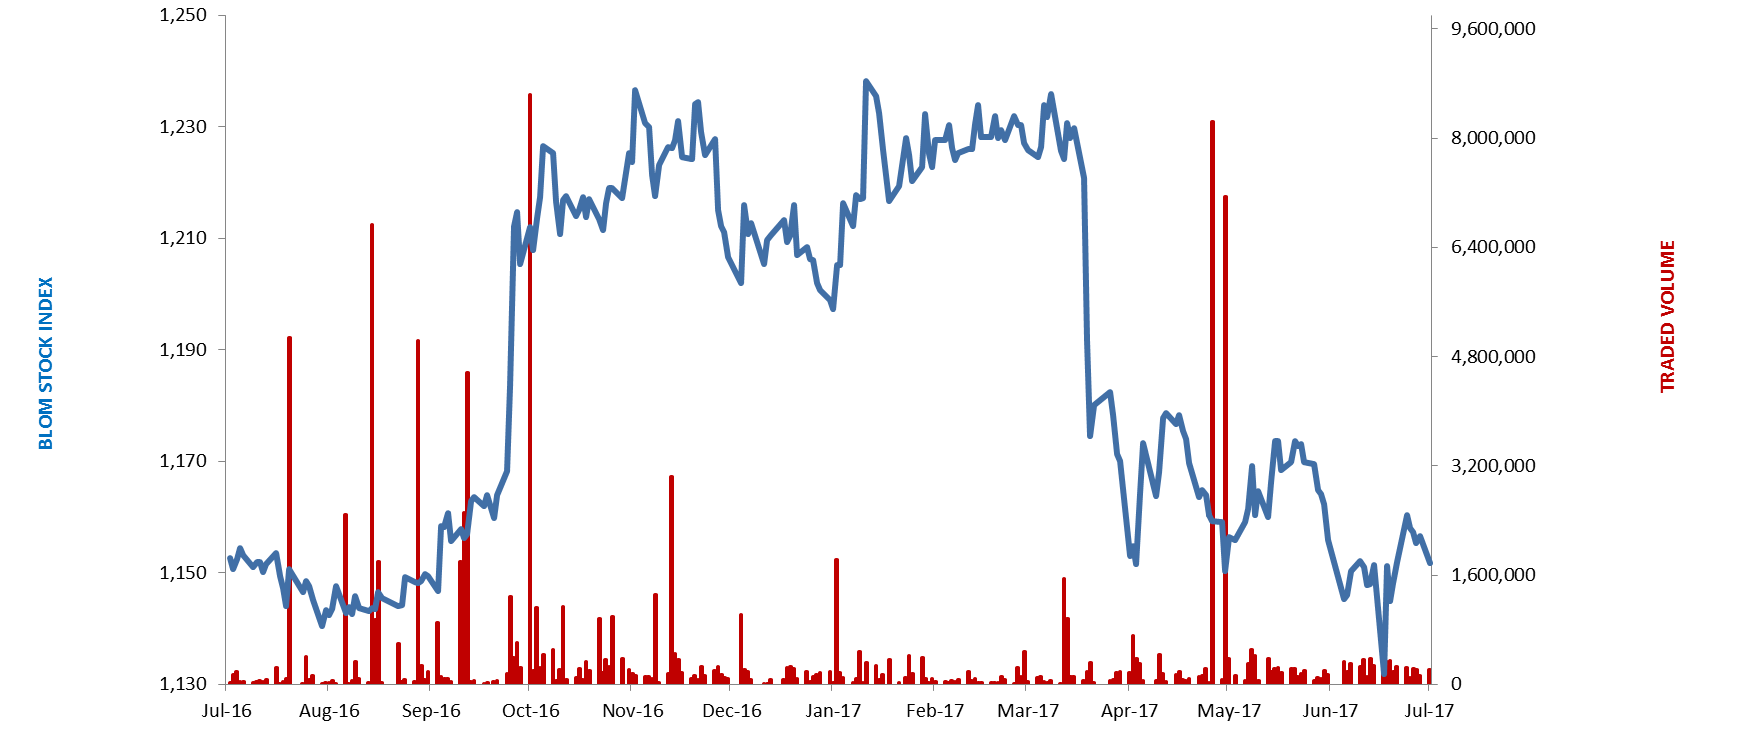
The BLOM Stock Index
Lebanese Global Depository Receipts: Last session’s Performance
| GDRs | Last Price ($) | Previous Price ($) | % Change | Volume | Value ($) |
| BLOM GDR | 12.15 | 12.25 | -0.8% | 126 | 1,539 |
| Audi GDR | 6.18 | 6.18 | 0.0% | – | – |
| Byblos GDR | 80 | 80 | 0.0% | – | – |
Source: London Stock Exchange
Closing Date: 21 July 2017
BLOM BOND INDEX: Last Session’s Performance
| Last | Previous | Change | Y-t-D Change | ||
| BBI | 104.45 | 104.39 | 0.06% | 2.50% | |
| Weighted Yield | 6.235% | 6.240% | -1 | bps | |
| Duration (Years) | 5.19 | 5.20 | |||
| 5Y Bond Yield | 6.18% | 6.21% | -3 | bps | |
| 5Y Spread* | 437 | 439 | -2 | bps | |
| 10Y Bond Yield | 6.78% | 6.80% | -2 | bps | |
| 10Y Spread* | 454 | 453 | 1 | bps | |
*between Lebanese Eurobonds and US Treasuries
Closing Date: 21 July 2017
Lebanese Eurobonds: Last Sessions’ Prices and Yields
| Price | Yield | Yield Change | |
| 12/06/2018 | 100.38 | 4.70% | 0 |
| 12/11/2018 | 100.38 | 4.84% | 9 |
| 23/04/2019 | 100.05 | 5.46% | 0 |
| 20/05/2019 | 100.88 | 5.48% | 0 |
| 28/11/2019 | 99.75 | 5.56% | 0 |
| 09/03/2020 | 101.75 | 5.65% | 0 |
| 14/04/2020 | 100.25 | 5.70% | 0 |
| 19/06/2020 | 101.00 | 5.77% | 0 |
| 12/04/2021 | 107.38 | 6.00% | -7 |
| 04/10/2022 | 99.50 | 6.21% | -3 |
| 27/01/2023 | 98.75 | 6.27% | 0 |
| 22/04/2024 | 100.88 | 6.48% | 0 |
| 04/11/2024 | 98.65 | 6.48% | 0 |
| 03/12/2024 | 102.95 | 6.49% | -1 |
| 26/02/2025 | 98.15 | 6.51% | 0 |
| 12/06/2025 | 98.15 | 6.55% | 0 |
| 28/11/2026 | 99.75 | 6.63% | -5 |
| 23/03/2027 | 100.63 | 6.76% | -2 |
| 29/11/2027 | 99.63 | 6.80% | -2 |
| 03/11/2028 | 98.38 | 6.86% | 0 |
| 26/02/2030 | 98.00 | 6.89% | 0 |
| 22/04/2031 | 100.25 | 6.97% | 0 |
| 23/03/2032 | 100.00 | 7.00% | 0 |
| 02/11/2035 | 98.88 | 7.16% | 1 |
| 23/03/2037 | 100.00 | 7.25% | 1 |
| Last Price | Previous | % Change | Y-t-D | |
| $/LBP | 1,513.75 | 1,514.00 | -0.02% | |
| €/LBP | 1,756.09 | 1,757.90 | -0.10% | |
| £/LBP | 1,964.42 | 1,958.54 | 0.30% | |
| NEER | 112.52 | 112.45 | 0.06% | -4.97% |
Closing Date: 24 July 2017