
Discover today’s performance of BLOM indices, the closing prices of Lebanese stocks and Eurobonds, as well as the exchange rate of major currencies against the LBP.
BLOM Stock Index (BSI): Today’s Performance
| Last | Previous | % Change | Y-t-D Change | |
| BSI | 1,150.22 | 1,147.10 | 0.27% | -5.15% |
| High | 1,151.35 | 1,148.04 | ||
| Low | 1,148.40 | 1,145.20 | ||
| Volume | 88,509 | 95,370 | -7.19% | |
| Val ($) | 779,599 | 679,502 | 14.73% |
BLOM Preferred Shares Index (BPSI): Today’s Performance
| Last | Previous | Change | |
| BPSI | 104.73 | 104.74 | -0.01% |
| Volume | – | 434 | |
| Value | – | 43,701 |
Lebanese Stocks: Today’s Trades and Closing Prices
| Last Price ($) | % Change | Volume | VWAP ($) | |
| Solidere A | 7.99 | 3.10% | 63,608 | 7.86 |
| Bank Audi GDR | 6.01 | -1.48% | 700 | 6.01 |
| Byblos Bank – Listed | 1.63 | -0.61% | 591 | 1.63 |
| BLOM – Listed | 11.3 | 0.44% | 16,862 | 11.3 |
| BLOM GDR | 12.49 | 1.13% | 6,528 | 12.49 |
| HOLCIM | 11.7 | 0.43% | 220 | 11.7 |
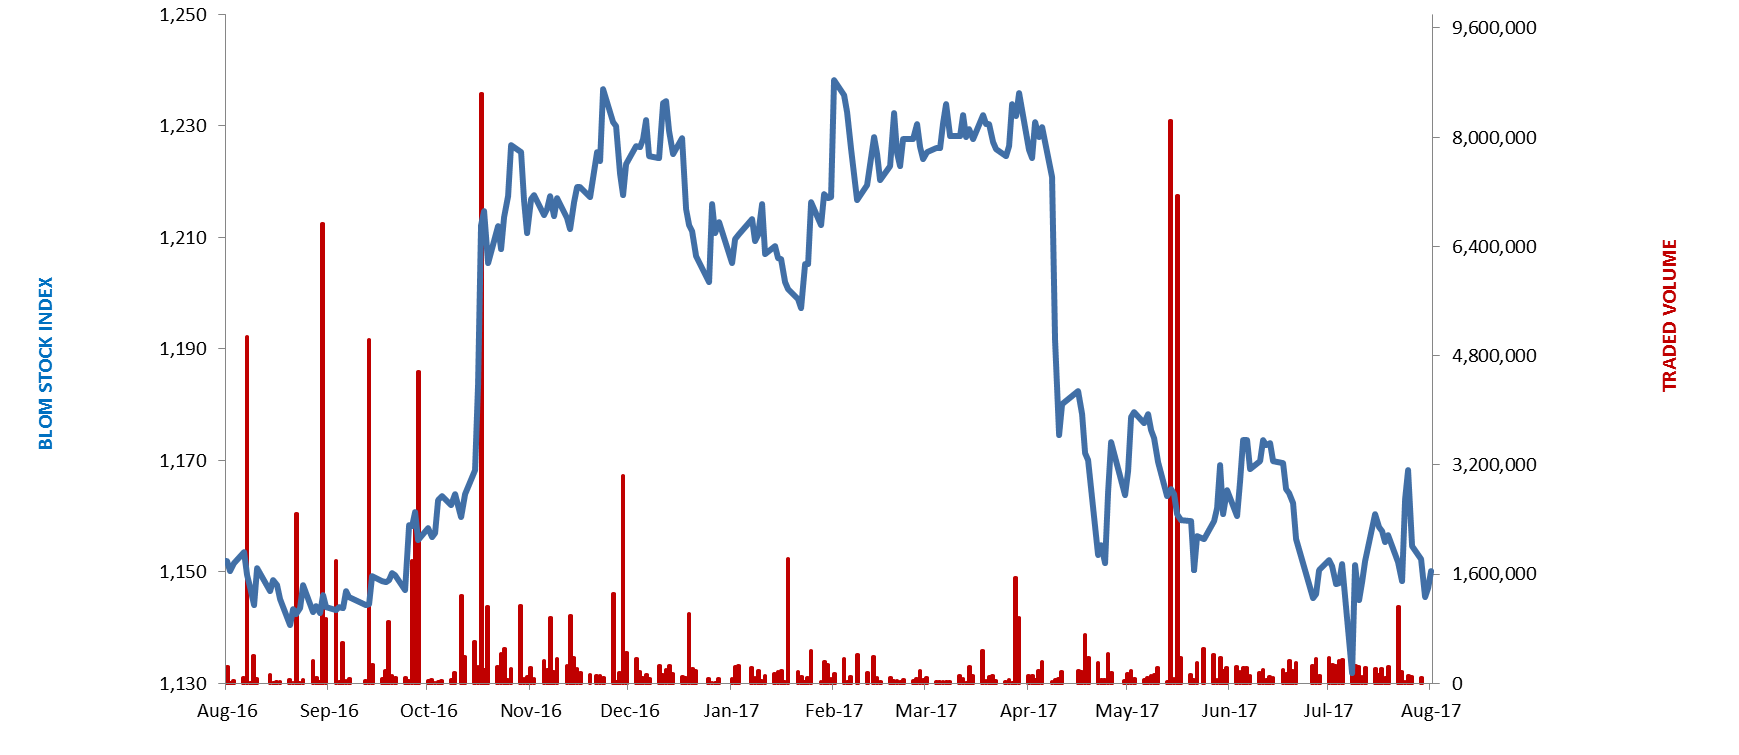
The BLOM Stock Index
Lebanese Global Depository Receipts: Last session’s Performance
| GDRs | Last Price ($) | Previous Price ($) | % Change | Volume | Value ($) |
| BLOM GDR | 12.4 | 12.35 | 0.4% | 2,222 | 27,553 |
| Audi GDR | 6.03 | 6.09 | -1.0% | 13,282 | 80,090 |
| Byblos GDR | 80 | 80 | 0.0% | – | – |
Source: London Stock Exchange
Closing Date: 02 Aug 2017
BLOM BOND INDEX: Last Session’s Performance
| Last | Previous | Change | Y-t-D Change | ||
| BBI | 104.66 | 104.49 | 0.17% | 2.71% | |
| Weighted Yield | 6.185% | 6.223% | -4 | bps | |
| Duration (Years) | 5.17 | 5.17 | |||
| 5Y Bond Yield | 6.13% | 6.19% | -6 | bps | |
| 5Y Spread* | 431 | 439 | -8 | bps | |
| 10Y Bond Yield | 6.73% | 6.79% | -6 | bps | |
| 10Y Spread* | 446 | 453 | -7 | bps | |
*between Lebanese Eurobonds and US Treasuries
Closing Date: 2 August 2017
Lebanese Eurobonds: Last Sessions’ Prices and Yields
| Price | Yield | Yield Change | |
| 12/06/2018 | 100.50 | 4.54% | 0 |
| 12/11/2018 | 100.50 | 4.74% | -11 |
| 23/04/2019 | 100.25 | 5.34% | -8 |
| 20/05/2019 | 101.13 | 5.33% | -9 |
| 28/11/2019 | 99.88 | 5.50% | -1 |
| 09/03/2020 | 101.88 | 5.59% | -6 |
| 14/04/2020 | 100.25 | 5.69% | -2 |
| 19/06/2020 | 101.00 | 5.77% | -2 |
| 12/04/2021 | 107.38 | 5.99% | -1 |
| 04/10/2022 | 99.75 | 6.15% | -7 |
| 27/01/2023 | 98.75 | 6.27% | -4 |
| 22/04/2024 | 101.13 | 6.44% | -4 |
| 04/11/2024 | 98.88 | 6.44% | -5 |
| 03/12/2024 | 103.13 | 6.46% | -7 |
| 26/02/2025 | 98.38 | 6.47% | -4 |
| 12/06/2025 | 98.38 | 6.51% | -4 |
| 28/11/2026 | 100.00 | 6.60% | -6 |
| 23/03/2027 | 101.00 | 6.71% | -6 |
| 29/11/2027 | 100.00 | 6.75% | -6 |
| 03/11/2028 | 98.50 | 6.84% | -4 |
| 26/02/2030 | 98.50 | 6.83% | -4 |
| 22/04/2031 | 100.38 | 6.95% | -8 |
| 23/03/2032 | 100.13 | 6.98% | -4 |
| 02/11/2035 | 99.38 | 7.11% | -6 |
| 23/03/2037 | 100.50 | 7.20% | -3 |
| Last Price | Previous | % Change | Y-t-D | |
| $/LBP | 1,514.00 | 1,513.75 | 0.02% | |
| €/LBP | 1,784.58 | 1,768.30 | 0.92% | |
| £/LBP | 1,984.32 | 1,977.39 | 0.35% | |
| NEER | 111.86 | 111.96 | -0.09% | -5.53% |
Closing Date: 3 August 2017