Discover today’s performance of BLOM indices, the closing prices of Lebanese stocks and Eurobonds, as well as the exchange rate of major currencies against the LBP.
BLOM Stock Index (BSI) – Today’s performance
| Last | Previous | % Change | Y-t-D Change | |
| BSI | 620.68 | 619.15 | 0.25% | -20.99% |
| High | 625.20 | 705.10 | ||
| Low | 619.10 | 618.20 | ||
| Volume | 50,884 | 56,807 | ||
| Val ($) | 410,751 | 300,672 |
I): BLOM preferred Shares Index (BPSI): today’s Performance
| Last | Previous | Change | |
| BPSI | 66.67 | 66.67 | 0.00% |
| Volume | |||
| Value |
Lebanese Stocks: today’s Trades and Closing Prices
| Last Price ($) | % Change | Volume | VWAP ($) | |
| Solidere A | 8.47 | -0.82% | 37,811 | 8.5 |
| Solidere B | 8.47 | -0.24% | 9,061 | 8.5 |
| BEMO- Listed Shares | 1.15 | -4.17% | 1,000 | 1.20 |
| Blom Bank – Listed Shares | 3.83 | 3.23% | 3,000 | 3.83 |
| BLOM GDR | 3.00 | 0.00% | 3 | 3.00 |
Closing Date: 20 February 2020
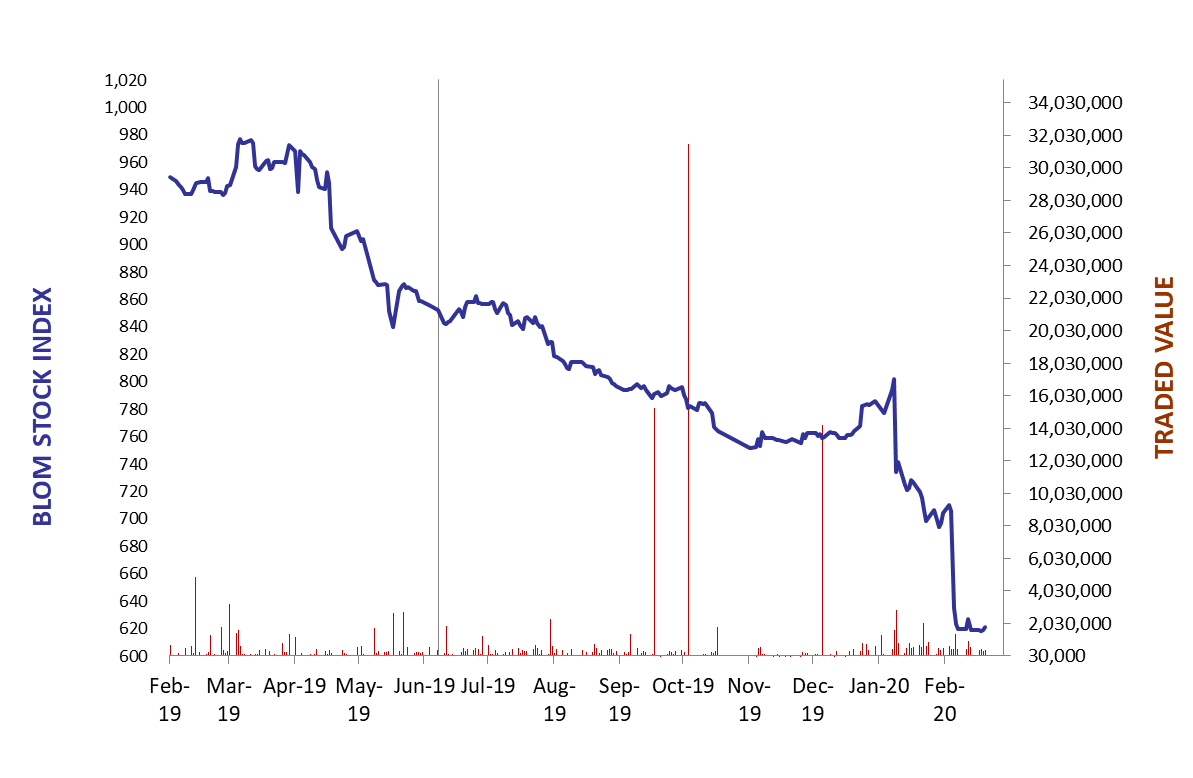
The BLOM Stock Index
Lebanese Global Depository Receipts: Last Session’s Performance
| GDRs | Last Price ($) | Previous Price ($) | % Change | Volume | Value ($) |
| BLOM GDR | 2.04 | 2.04 | 0.00% | ||
| Audi GDR | 1.4 | 1.4 | 0.00% | ||
| Byblos GDR | 70 | 70 | 0.00% | – | – |
Closing Date: 18, February 2020
Source: London Stock Exchange
BLOM BOND INDEX: Last Session’s Performance
| Last | Previous | Change | Y-t-D Change | ||
| BBI | 32.25 | 36.15 | -10.78% | -36.27% | |
| Weighted Yield | 53.10% | 46.61% | 650 | bps | |
| Duration (Years) | 3.37 | 3.54 | |||
| 5Y Bond Yield | 60.50% | 57.10% | 340 | bps | |
| 5Y Spread* | 5,911 | 5,573 | 338 | bps | |
| 10Y Bond Yield | 33.00% | 29.40% | 360 | bps | |
| 10Y Spread* | 3,150 | 2,792 | 358 | bps | |
*between Lebanese Eurobonds and US Treasuries
Closing Date: 19 February 2020
Lebanese Eurobonds: Last Sessions’ Prices and Yields
| Price | Yield | Yield Change | |
| 4/12/2021 | 30.83 | 153.07% | 2947 |
| 10/4/2022 | 30.71 | 63.67% | 481 |
| 1/27/2023 | 30.77 | 57.40% | 323 |
| 4/22/2024 | 30.96 | 44.32% | 209 |
| 11/4/2024 | 30.40 | 40.42% | 257 |
| 12/3/2024 | 29.00 | 43.37% | 429 |
| 2/26/2025 | 29.23 | 39.84% | 351 |
| 6/12/2025 | 29.61 | 37.97% | 356 |
| 11/28/2026 | 28.46 | 34.49% | 351 |
| 3/23/2027 | 28.75 | 33.99% | 330 |
| 11/29/2027 | 28.21 | 32.64% | 325 |
| 11/3/2028 | 29.33 | 29.74% | 262 |
| 2/26/2030 | 29.11 | 28.14% | 244 |
| 4/22/2031 | 28.99 | 28.07% | 235 |
| 3/23/2032 | 29.40 | 26.99% | 202 |
| 11/2/2035 | 29.33 | 25.49% | 208 |
| 3/23/2037 | 29.55 | 25.56% | 192 |
Lebanese Forex Market
| Last Price | Previous | % Change | Y-t-D | |
| $/LBP | 1,514.25 | 1,514.25 | – | |
| €/LBP | 1,627.20 | 1,628.85 | -0.10% | |
| £/LBP | 1,939.10 | 1,947.69 | -0.44% | |
| NEER | 120.04 | 119.80 | 0.20% |
Closing Date: 20 February 2020