Discover today’s performance of BLOM indices, the closing prices of Lebanese stocks and Eurobonds, as well as the exchange rate of major currencies against the LBP.
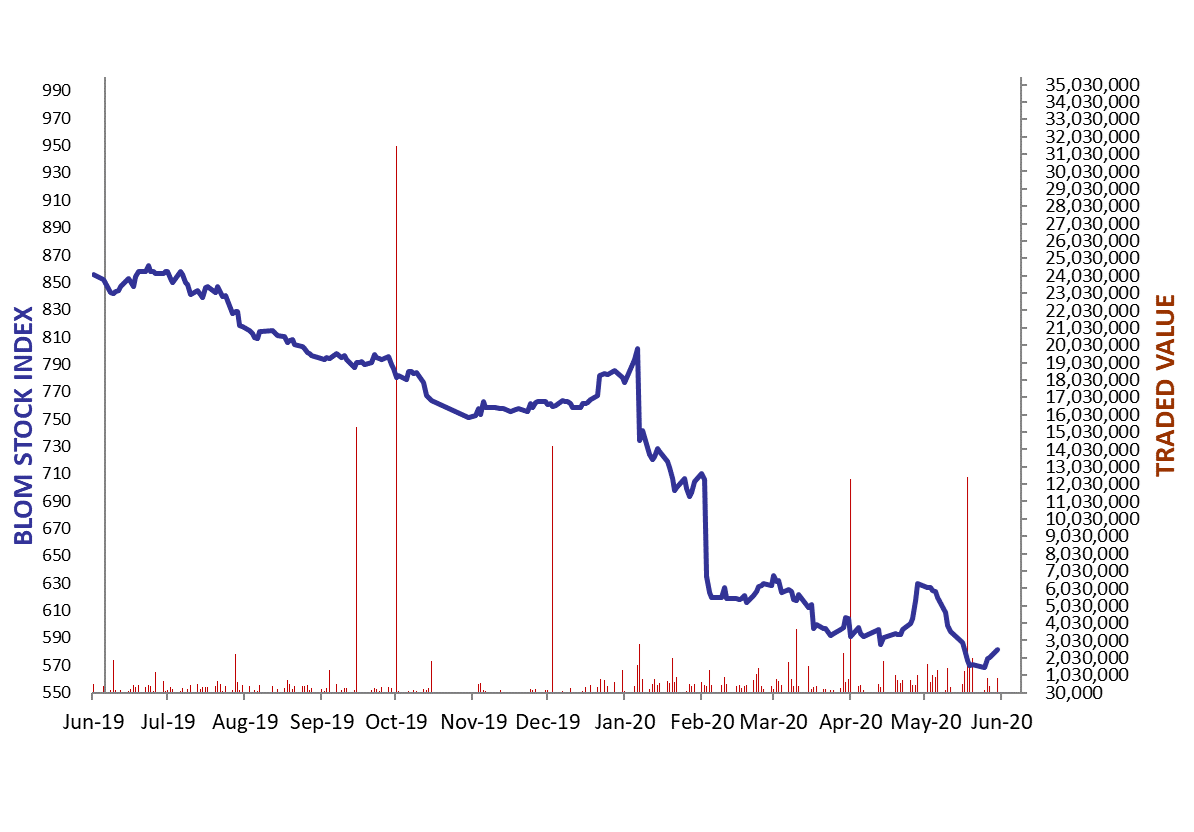
BLOM Stock Index (BSI) – today’s performance
| Last | Previous | % Change | Y-t-D Change | |
| BSI | 581.24 | 575.37 | 1.02% | -26.01% |
| High | 586.03 | 579.02 | ||
| Low | 575.37 | 568.75 | ||
| Volume | 81,184 | 92,411 | ||
| Val ($) | 845,416 | 397,091 |
I): BLOM preferred Shares Index (BPSI): today’s Performance
| Last | Previous | Change | |
| BPSI | 62.69 | 62.69 | 0.00% |
| Volume | |||
| Value |
Lebanese Stocks: today’s Trades and Closing Prices
| Last Price ($) | % Change | Volume | VWAP ($) | |
| Solidere A | 10.90 | 4.01% | 31,436 | 10.9 |
| Solidere B | 10.61 | 2.71% | 47,748 | 10.61 |
| Blom Bank listed Shares | 3.29 | 0.00% | 2,000 | 3.29 |
Closing Date: June 1, 2020
The BLOM Stock Index
Lebanese Global Depository Receipts: Last Session’s Performance
| Global Depository Receipts (GDRs) | Last Price ($) | Previous Price ($) | % Change | Volume | Value ($) |
| BLOM GDR | 1.500 | 1.500 | 0.00% | 40,000 | 60,000 |
| Audi GDR | 0.43 | 0.43 | 0.00% | ||
| Byblos GDR | 70 | 70 | 0.00% | – | – |
Closing Date: May 28, 2020
Source: London Stock Exchange
BLOM BOND INDEX: Last Session’s Performance
| Last | Previous | Change | Y-t-D Change | ||
| BBI | 16.14 | 16.13 | 0.01% | -68.08% | |
| Weighted Yield | 61.91% | 61.90% | 1 | bps | |
| Duration (Years) | 2.85 | 2.82 | |||
| 5Y Bond Yield | 104.80% | 105.20% | -40 | bps | |
| 5Y Spread* | 10,464 | 10,503 | -39 | bps | |
| 10Y Bond Yield | 48.70% | 48.80% | -10 | bps | |
| 10Y Spread* | 4,840 | 4,846 | -6 | bps | |
*spread between Lebanese Eurobonds and US Treasuries
Closing Date: May 29, 2020
Lebanese Eurobonds: Last Sessions’ Prices and Yields
| Price | Yield | Yield Change | |
| 10/4/2022 | 16.75 | 113.36% | 13 |
| 1/27/2023 | 17.33 | 97.72% | (29) |
| 4/22/2024 | 16.75 | 74.04% | 4 |
| 11/4/2024 | 17.33 | 64.38% | (23) |
| 12/3/2024 | 17.04 | 67.27% | 15 |
| 2/26/2025 | 16.75 | 62.32% | 3 |
| 6/12/2025 | 18.03 | 57.15% | 3 |
| 11/28/2026 | 17.23 | 51.59% | 1 |
| 3/23/2027 | 16.75 | 52.15% | 1 |
| 11/29/2027 | 17.23 | 48.56% | 1 |
| 11/3/2028 | 17.23 | 45.67% | (1) |
| 2/26/2030 | 16.75 | 44.12% | 0 |
| 4/22/2031 | 17.06 | 43.92% | 83 |
| 3/23/2032 | 17.23 | 42.64% | 0 |
| 11/2/2035 | 16.75 | 42.61% | (0) |
| 3/23/2037 | 16.75 | 43.42% | (0) |
Lebanese Forex Market
| Last Price | Previous | % Change | Y-t-D | |
| $/LBP | 1,514.25 | 1,514.25 | – | |
| €/LBP | 1,674.23 | 1,628.40 | 2.81% | |
| £/LBP | 1,867.19 | 1,861.01 | 0.33% | |
| NEER | 122.45 | 122.42 | 0.02% |
Closing Date: June 1, 2020