
Discover today’s performance of BLOM indices, the closing prices of Lebanese stocks and Eurobonds, as well as the exchange rate of major currencies against the LBP.
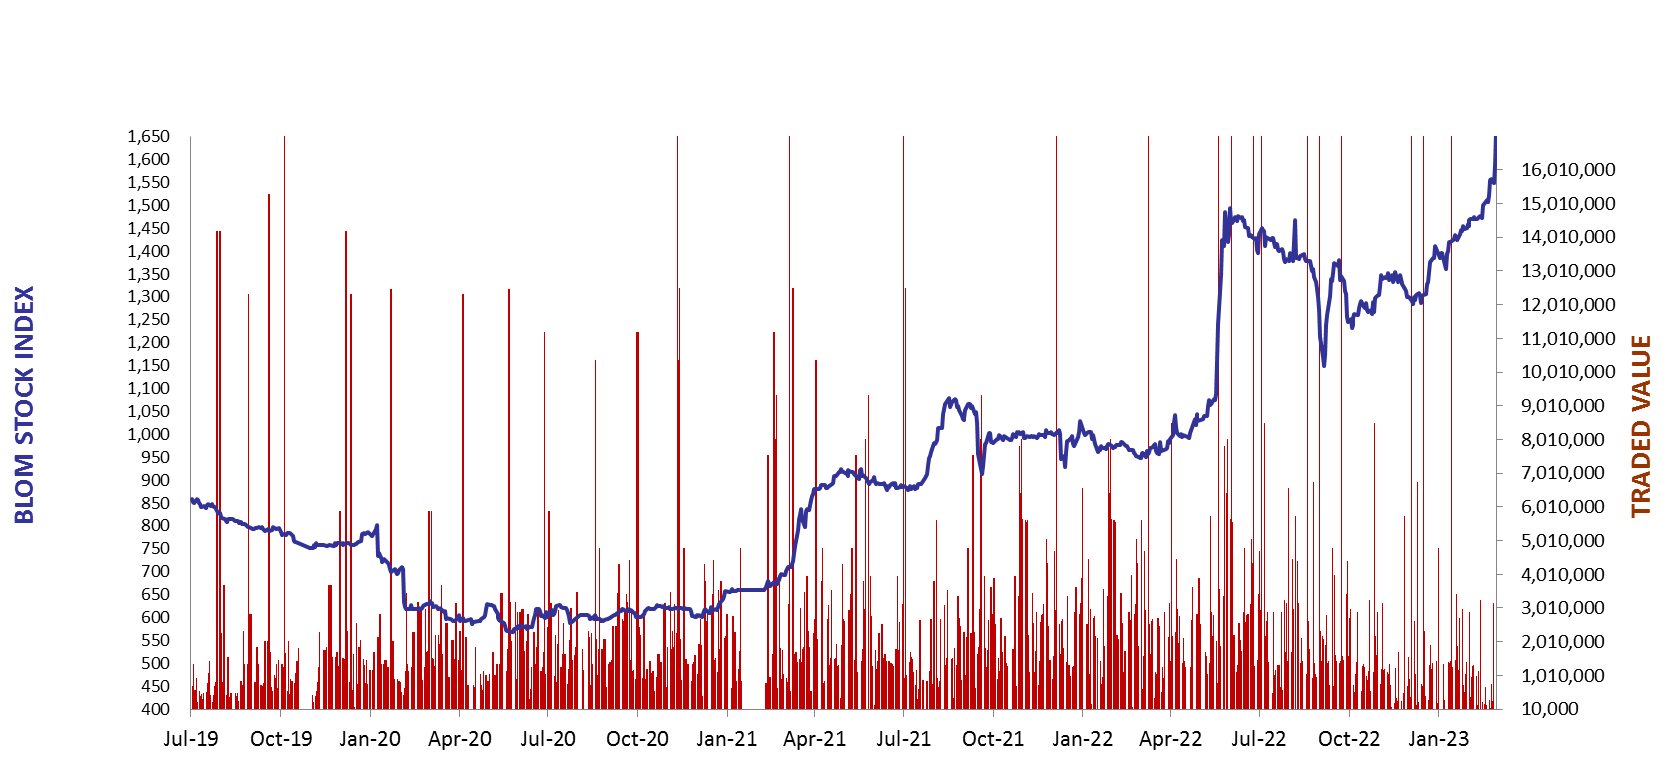
BLOM Stock Index (BSI) – today’s performance
| Last | Previous | % Change | Y-t-D Change | |
| BSI | 1,732.64 | 1,743.97 | -0.65% | 25.20% |
| High | 1,760.45 | 1,769.37 | ||
| Low | 1,721.42 | 1,673.56 | ||
| Volume | 12,800 | 32,238 | ||
| Val ($) | 724,118 | 1,343,070 |
I): BLOM preferred Shares Index (BPSI): today’s Performance
| Last | Previous | Change | |
| BPSI | 41.01 | 41.01 | 0.00% |
| Volume | |||
| Value |
Lebanese Stocks: today’s Trades and Closing Prices
| Last Price ($) | % Change | Volume | VWAP ($) | |
| Solidere A | 81.15 | -1.28% | 8,800 | 81.04 |
| Blom GDR | 2.75 | -5.17% | 4,000 | 2.8 |
Closing Date: March 06, 2023
The BLOM Stock Index
| Last | Previous | Change | Y-t-D Change | ||
| BBI | 7.16 | 7.19 | -0.36% | 18.79% | |
| Weighted Yield | 161.77% | 161.23% | 53 | bps | |
| Duration (Years) | 1.39 | 1.40 | |||
| 5Y Bond Yield | 128.60% | 128.20% | 40 | bps | |
| 5Y Spread* | 12,357 | 12,316 | 41 | bps | |
| 10Y Bond Yield | 100.30% | 99.94% | 36 | bps | |
| 10Y Spread* | 9,570 | 9,531 | 39 | bps |
BLOM BOND INDEX: Last Session’s Performance
| Price | Yield | Yield Change | |
| 22/04/2024 | 6.93 | 486.07% | 197 |
| 04/11/2024 | 6.93 | 285.58% | 63 |
| 03/12/2024 | 6.79 | 277.32% | 116 |
| 26/02/2025 | 6.93 | 238.09% | 53 |
| 12/06/2025 | 7.06 | 199.08% | 35 |
| 28/11/2026 | 6.93 | 132.23% | 49 |
| 23/03/2027 | 6.92 | 128.63% | 51 |
| 29/11/2027 | 6.89 | 115.62% | 72 |
| 03/11/2028 | 6.91 | 105.58% | 58 |
| 26/02/2030 | 6.85 | 101.24% | 50 |
| 22/04/2031 | 6.84 | 101.81% | (3) |
| 23/03/2032 | 6.96 | 100.32% | 4 |
| 02/11/2035 | 6.93 | 99.51% | 40 |
| 23/03/2037 | 6.98 | 102.75% | 3 |
*spread between Lebanese Eurobonds and US Treasuries
Closing Date: March 3, 2023
Lebanese Forex Market
| Last Price | Previous | % Change | |
| $/LBP | 15,000 | 15,000 | – |
| €/LBP | 15,949.50 | 15,952.50 | -0.02% |
| £/LBP | 18,010.50 | 18,054.00 | -0.24% |
| NEER | 116.97 | 116.91 | 0.05% |
Closing Date: March 06, 2023