
Discover today’s performance of BLOM indices, the closing prices of Lebanese stocks and Eurobonds, as well as the exchange rate of major currencies against the LBP.
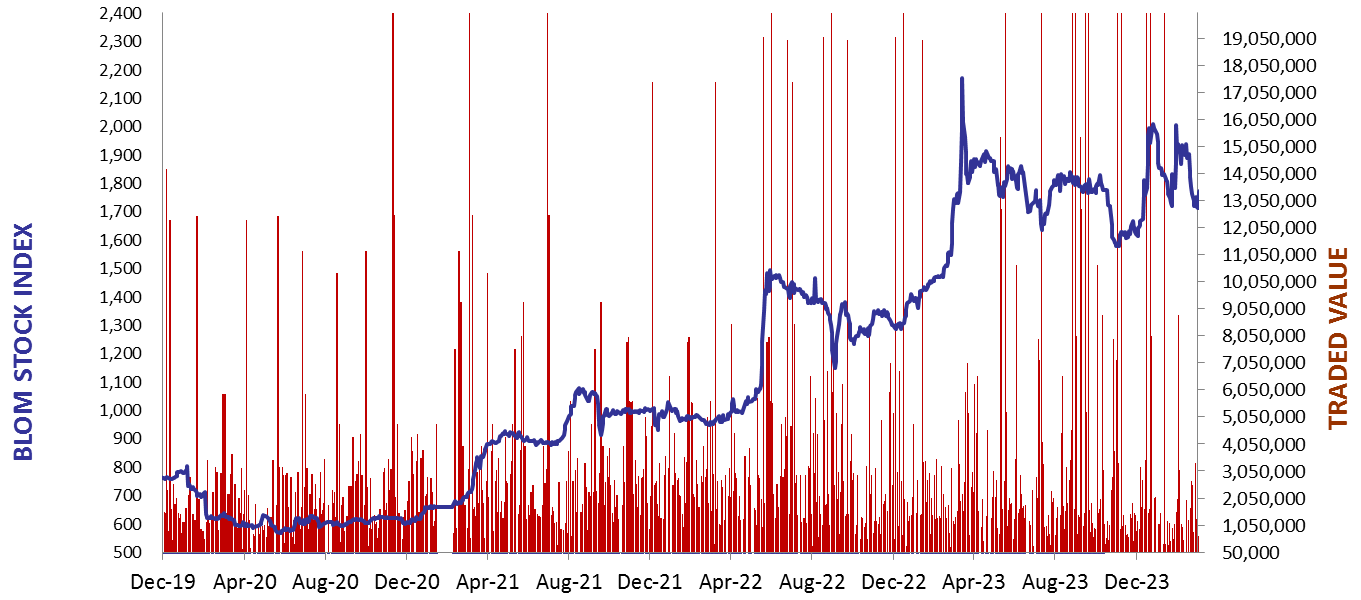
BLOM Stock Index (BSI) – today’s performance
| Last | Previous | % Change | Y-t-D Change | |
| BSI | 1,625.88 | 1,635.38 | -0.58% | -17.59% |
| High | 1,630.50 | 1,635.38 | ||
| Low | 1,620.50 | 1,631.67 | ||
| Volume | 2,841 | 14,860 | ||
| Val ($) | 200,670 | 1,032,147 |
I): BLOM preferred Shares Index (BPSI): today’s Performance
| Last | Previous | Change | |
| BPSI | 35.15 | 35.15 | 0.00% |
| Volume | |||
| Value |
Lebanese Stocks: today’s Trades and Closing Prices
| Last Price ($) | % Change | Volume | VWAP ($) | |
| Solidere A | 72.9 | -0.27% | 1,898 | 72.92 |
| Solidere B | 67.1 | 0.83% | 867 | 67.08 |
| HOLCIM | 54 | -9.70% | 76 | 54 |
Closing Date: April 26, 2024
The BLOM Stock Index
BLOM BOND INDEX: Last Session’s Performance
| Last | Previous | Change | Y-t-D Change | ||
| BBI | 5.79 | 5.79 | -0.04% | -4.01% | |
| Weighted Yield | 226.18% | 225.47% | 71 | bps | |
| Duration (Years) | 1.30 | 1.31 | |||
| 5Y Bond Yield | 111.00% | 111.00% | 0 | bps | |
| 5Y Spread* | 10,579 | 10,583 | -4 | bps | |
| 10Y Bond Yield | 109.90% | 109.95% | -5 | bps | |
| 10Y Spread* | 10,505 | 10,517 | -12 | bps |
*spread between Lebanese Eurobonds and US Treasuries
| Price | Yield | Yield Change | |
| 26/02/2025 | 6.39 | 855.19% | 555 |
| 12/06/2025 | 6.56 | 504.80% | 219 |
| 28/11/2026 | 6.29 | 190.60% | 26 |
| 23/03/2027 | 6.36 | 173.09% | 16 |
| 29/11/2027 | 6.44 | 144.51% | 15 |
| 03/11/2028 | 6.40 | 125.82% | 29 |
| 26/02/2030 | 6.44 | 110.22% | (0) |
| 22/04/2031 | 6.42 | 112.06% | 4 |
| 23/03/2032 | 6.42 | 108.86% | (4) |
| 02/11/2035 | 6.42 | 109.34% | 17 |
| 23/03/2037 | 6.47 | 110.24% | (10) |
Closing Date: April 25, 2024
Lebanese Forex Market
| Last Price | Previous | % Change | |
| $/LBP | 89,500 | 89,500 | – |
| €/LBP | 95,702.35 | 96,033.50 | -0.34% |
| £/LBP | 111,812.35 | 112,000.30 | -0.17% |
| NEER | 228.08 | 228.14 | -0.03% |
Closing Date: April 26, 2024