
Discover today’s performance of BLOM indices, the closing prices of Lebanese stocks and Eurobonds, as well as the exchange rate of major currencies against the LBP.
BLOM Stock Index (BSI): Today’s Performance
| Last | Previous | % Change | Y-t-D Change | |
| BSI | 1,154.76 | 1,152.93 | 0.16% | -4.78% |
| High | 1,154.76 | 1,155.65 | ||
| Low | 1,149.82 | 1,149.52 | ||
| Volume | 710,796 | 171,860 | 313.59% | |
| Val ($) | 6,574,986 | 1,686,679 | 289.82% |
BLOM Preferred Shares Index (BPSI): Today’s Performance
| Last | Previous | Change | |
| BPSI | 105.89 | 105.86 | 0.03% |
| Volume | 18,088 | – | |
| Value | 1,814,935 | – |
Lebanese Stocks: Today’s Trades and Closing Prices
| Last Price ($) | % Change | Volume | Value | VWAP ($) | |
| Solidere A | 8.17 | 10.41% | 143,484 | 1,103,355 | 7.69 |
| Solidere B | 7.96 | -1.00% | 5,129 | 41,321 | 8.06 |
| Bank Audi | 6.21 | -2.97% | 490,320 | 3,040,734 | 6.20 |
| Bank Audi Pref G | 100.20 | – | 11,500 | 1,152,300 | 100.20 |
| Bank Audi Pref H | 100.40 | 0.40% | 2,588 | 259,835 | 100.40 |
| Bank Audi Pref I | 100.70 | 0.10% | 4,000 | 402,800 | 100.70 |
| Byblos Bank | 1.70 | – | 595 | 1,012 | 1.70 |
| Blom Listed | 10.50 | -0.19% | 41,000 | 430,550 | 10.50 |
| Blom GDR | 11.75 | – | 12,000 | 141,000 | 11.75 |
| HOLCIM | 11.55 | -0.26% | 180 | 2,079 | 11.55 |
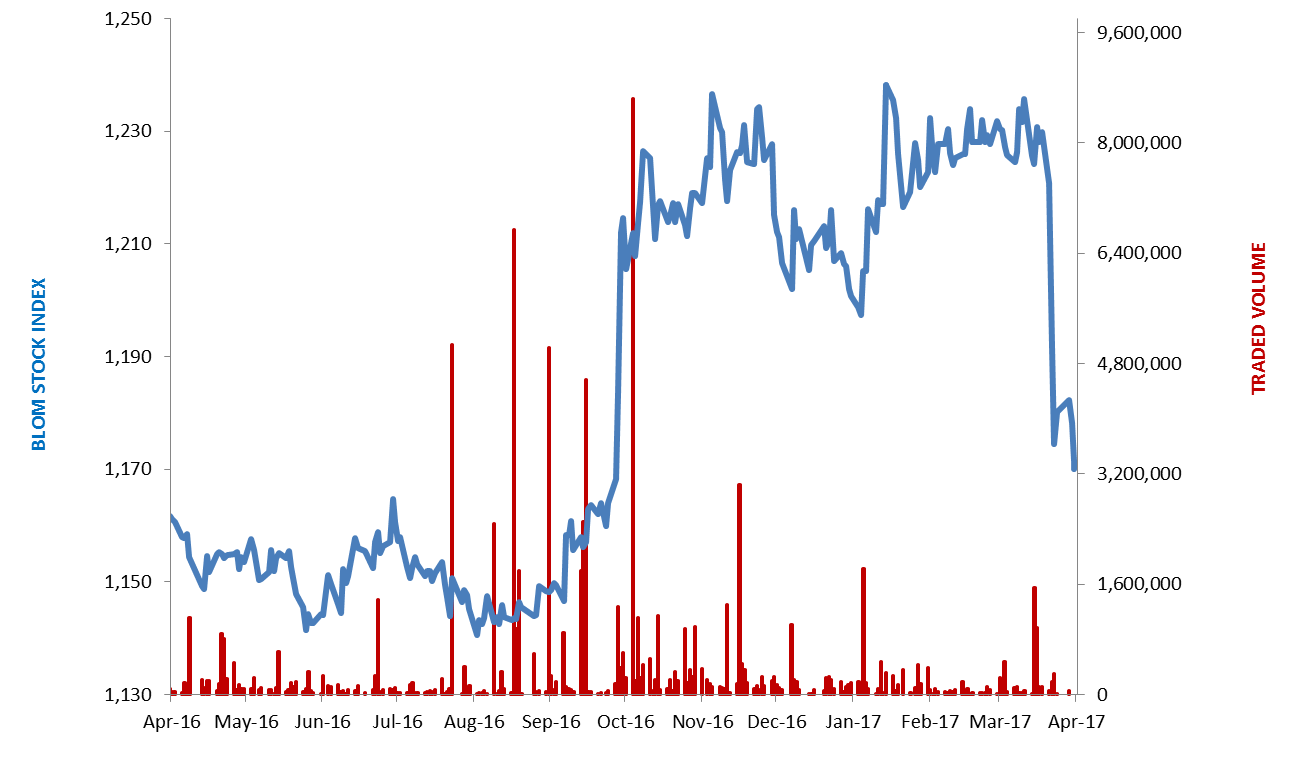
The BLOM Stock Index
Lebanese Global Depository Receipts: Last session’s Performance
| GDRs | Last Price ($) | Previous Price ($) | % Change | Volume | Value ($) |
| BLOM GDR | 11.70 | 11.70 | – | – | – |
| Audi GDR | 6.71 | 6.71 | – | – | – |
| Byblos GDR | 82.00 | 82.00 | – | – | – |
| Solidere GDR | 8.25 | 8.50 | -2.94% | 29,574 | 243,986 |
Source: Reuters
Closing Date: 24 April 2017
BLOM BOND INDEX: Last Session’s Performance
| Last | Previous | Change | Y-t-D Change | ||
| BBI | 106.311 | 106.411 | -0.09% | 4.33% | |
| Weighted Yield | 5.785% | 5.765% | 1.94 | bps | |
| Duration (Years) | 5.38 | 5.38 | |||
| 5Y Bond Yield | 5.46% | 5.58% | -12 | bps | |
| 5Y Spread* | 365 | 381 | -15.5 | bps | |
| 10Y Bond Yield | 6.56% | 6.53% | 3 | bps | |
| 10Y Spread* | 428 | 429 | -1 | bps | |
*between Lebanese Eurobonds and US Treasuries
Closing Date: 24 April 2017
Lebanese Eurobonds: Last Sessions’ Prices and Yields
| Price | Yield | Yield Change | |
| 12/06/2018 | 101.21 | 4.05% | 11 |
| 12/11/2018 | 101.13 | 4.39% | 0 |
| 23/04/2019 | 102.18 | 4.35% | 0 |
| 20/05/2019 | 102.59 | 4.67% | 9 |
| 28/11/2019 | 101.78 | 4.71% | 1 |
| 09/03/2020 | 103.97 | 4.87% | 10 |
| 14/04/2020 | 101.99 | 5.07% | -3 |
| 19/06/2020 | 102.88 | 5.15% | -4 |
| 12/04/2021 | 110.45 | 5.30% | 4 |
| 04/10/2022 | 102.66 | 5.53% | -10 |
| 27/01/2023 | 101.63 | 5.66% | 5 |
| 22/04/2024 | 102.88 | 6.14% | 6 |
| 04/11/2024 | 99.92 | 6.26% | 1 |
| 03/12/2024 | 104.11 | 6.31% | -2 |
| 26/02/2025 | 99.67 | 6.25% | 3 |
| 12/06/2025 | 100.49 | 6.17% | 0 |
| 28/11/2026 | 100.82 | 6.48% | 1 |
| 23/03/2027 | 102.21 | 6.54% | 2 |
| 29/11/2027 | 100.70 | 6.66% | 5 |
| 03/11/2028 | 99.52 | 6.71% | -2 |
| 26/02/2030 | 99.32 | 6.73% | 2 |
| 22/04/2031 | 100.77 | 6.91% | 3 |
| 23/03/2032 | 101.38 | 6.85% | 1 |
| 02/11/2035 | 99.68 | 7.08% | 2 |
| 23/03/2037 | 100.90 | 7.16% | 2 |
| Last Price | Previous | % Change | Y-t-D | |
| $/LBP | 1,514.25 | 1,514.25 | – | |
| €/LBP | 1,638.65 | 1,621.17 | 1.08% | |
| £/LBP | 1,928.54 | 1,931.41 | -0.15% | |
| NEER | 115.78 | 115.90 | -0.10% | -2.22% |
Closing Date: 25 April 2017