
Discover today’s performance of BLOM indices, the closing prices of Lebanese stocks and Eurobonds, as well as the exchange rate of major currencies against the LBP.
BLOM Stock Index (BSI): Today’s Performance
| Last | Previous | %Change | Y-t-D Change | |
| BSI | 1,221.33 | 1,229.93 | -0.70% | 4.43% |
| High | 1,230.03 | 1,230.98 | ||
| Low | 1,219.75 | 1,228.82 | ||
| Volume | 81,059 | 107,943 | -24.91% | |
| Val ($) | 1,045,641 | 1,060,681 | -1.42% |
BLOM Preferred Shares Index (BPSI): Today’s Performance
| Last | Previous | Change | |
| BPSI | 104.86 | 104.96 | -0.10% |
| Volume | 7,083 | 682 | |
| Value | 417,104 | 69,564 |
Lebanese Stocks: Today’s Trades and Closing Prices
| Last Price ($) | % Change | Volume | VWAP ($) | |
| Solidere A | 11.09 | -0.27% | 22,122 | 11.07 |
| Solidere B | 11.02 | -0.09% | 3,777 | 11.02 |
| BLC (C) | 0.99 | -41.20% | 4 | 0.99 |
| Audi GDR | 6.66 | -3.06% | 34,070 | 6.66 |
| Bank of Beirut Preferred H | 26.25 | – | 3,400 | 26.25 |
| BoB Pref I | 26.25 | – | 600 | 26.25 |
| Byblos Listed | 1.69 | – | 3,400 | 1.69 |
| Byblos Preferred 2009 | 101.20 | -0.78% | 3,083 | 101.23 |
| BLOM Listed | 10.30 | – | 10,000 | 10.30 |
| BLOM GDR | 10.90 | 0.93% | 603 | 10.90 |
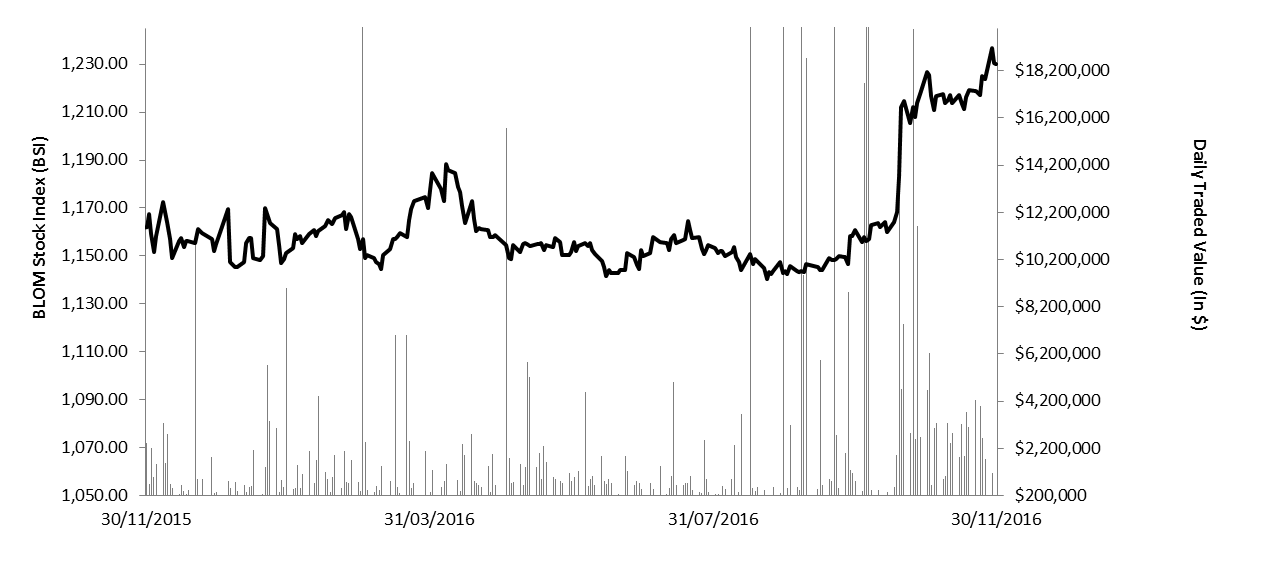
The BLOM Stock Index 52-WEEK TREND
Lebanese Global Depository Receipts: Last session’s Performance
| GDRs | Last Price ($) | Previous Price ($) | % Change | Volume | Value ($) |
| BLOM GDR | 10.80 | 10.85 | -0.46% | 21,764 | 235,051 |
| Audi GDR | 6.80 | 6.80 | – | – | – |
| Byblos GDR | 79.00 | 79.00 | – | – | – |
| Solidere GDR | 11.00 | 10.85 | 1.38% | 5,000 | 55,000 |
Source: Reuters
Closing Date: 29 November 2016
BLOM BOND INDEX: Last Session’s Performance
| Last | Previous | Change | Y-t-D Change | ||
| BBI | 99.84 | 99.93 | -0.09% | -4.10% | |
| Weighted Yield | 7.08% | 7.06% | 1 | bps | |
| Duration (Years) | 5.10 | 5.09 | |||
| 5Y Bond Yield | 6.93% | 6.93% | 0 | bps | |
| 5Y Spread* | 515 | 513 | 2 | bps | |
| 10Y Bond Yield | 7.51% | 7.48% | 3 | bps | |
| 10Y Spread* | 521 | 516 | 5 | bps | |
*between Lebanese Eurobonds and US Treasuries
Closing Date: 29 November 2016
Lebanese Eurobonds: Last Sessions’ Prices and Yields
| day/month/year | Price | Yield | Yield Change(in bps) |
| 12/06/2018 | 98.50 | 6.19% | 0 |
| 12/11/2018 | 98.00 | 6.25% | 0 |
| 23/04/2019 | 98.00 | 6.41% | -11 |
| 20/05/2019 | 99.00 | 6.44% | -11 |
| 28/11/2019 | 97.13 | 6.52% | -5 |
| 09/03/2020 | 99.00 | 6.72% | 0 |
| 14/04/2020 | 97.25 | 6.72% | 0 |
| 19/06/2020 | 98.00 | 6.79% | 4 |
| 12/04/2021 | 104.75 | 6.97% | 6 |
| 04/10/2022 | 95.13 | 7.13% | 5 |
| 27/01/2023 | 94.25 | 7.17% | 5 |
| 22/04/2024 | 96.13 | 7.34% | 5 |
| 04/11/2024 | 93.38 | 7.37% | 4 |
| 03/12/2024 | 97.75 | 7.38% | 4 |
| 26/02/2025 | 92.50 | 7.43% | 7 |
| 12/06/2025 | 92.50 | 7.45% | 6 |
| 28/11/2026 | 93.50 | 7.54% | 2 |
| 29/11/2027 | 93.88 | 7.58% | 2 |
| 03/11/2028 | 92.50 | 7.62% | 2 |
| 26/02/2030 | 91.50 | 7.68% | -2 |
| 22/04/2031 | 93.88 | 7.71% | -3 |
| 02/11/2035 | 93.00 | 7.76% | -3 |
| Last Price | Previous | % Change | Y-t-D | |
| $/LBP | 1,514.00 | 1,514.00 | – | |
| €/LBP | 1,602.32 | 1,605.04 | -0.17% | |
| £/LBP | 1,880.00 | 1,882.57 | -0.14% | |
| NEER | 117.56 | 118.24 | -0.58% | 7.46% |
Closing Date: 30 November