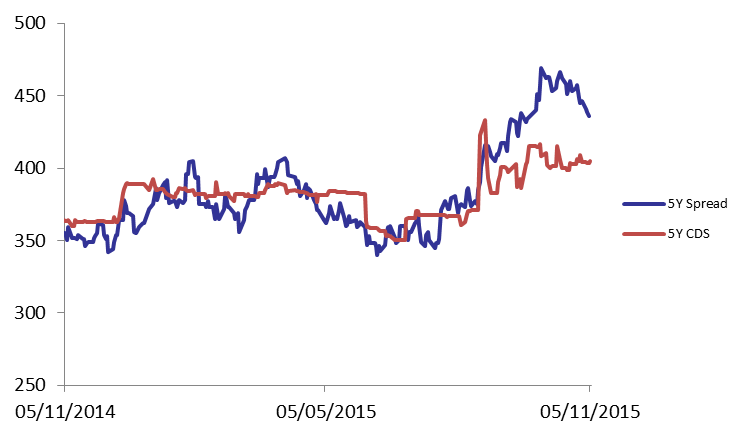
Appetite for Lebanese Eurobonds was lackluster Thursday illustrated by the numerous hikes on the yield. Accordingly, the BLOM Bond Index (BBI) declined by 0.08% to 104.70 points, broadening its year-to-date loss to 2.58%. Yields on the 5Y and 10Y Lebanese Eurobonds went up by 2 basis points (bps) and 3 bps to 6.02% and 6.51%, respectively. Similarly, demand for medium term maturities in the U.S. declined but at a slower pace than that of its Lebanese counterpart, causing the 5Y spread between both notes to broaden by 1 bp to 437 bps. As for the Lebanese 5Y Credit Default Swaps (CDS), they slightly widened from 391-416 bps to 392-417 bps.
| Last | Previous | Change | Y-t-D Change | ||
| BBI | 104.696 | 104.782 | -0.082% | -2.58% | |
| Weighted Yield | 5.96% | 5.94% | 2 | bps | |
| Duration (Years) | 4.88 | 4.88 | |||
| 5Y Bond Yield | 6.02% | 6.00% | 2 | bps | |
| 5Y Spread* | 437 | 436 | 1 | bps | |
| 10Y Bond Yield | 6.51% | 6.48% | 3 | bps | |
| 10Y Spread* | 425 | 423 | 2 | bps | |
*Between Lebanese and U.S notes
| Price | Yield | Yield Change (in bps) | |
| Nov. 2016 | 100.24 | 4.50% | 14 |
| Mar. 2017 | 105.25 | 4.99% | 9 |
| Oct. 2017 | 99.75 | 5.14% | 0 |
| Jun. 2018 | 99.75 | 5.25% | 0 |
| Nov. 2018 | 99.5 | 5.33% | 0 |
| Apr. 2019 | 100 | 5.50% | 0 |
| May. 2019 | 101 | 5.68% | 8 |
| Nov.2019 | 98.75 | 5.80% | 4 |
| Mar. 2020 | 102 | 5.84% | 3 |
| Apr. 2020 | 99.75 | 5.86% | 0 |
| Apr. 2021 | 109.5 | 6.17% | 5 |
| Oct. 2022 | 99.5 | 6.19% | 2 |
| Jan. 2023 | 98.63 | 6.24% | 0 |
| Dec. 2024 | 104.25 | 6.38% | 2 |
| Feb. 2025 | 98.5 | 6.41% | 2 |
| Jun. 2025 | 98.5 | 6.46% | 4 |
| Nov. 2026 | 99.88 | 6.61% | 0 |
| Nov. 2027 | 100.63 | 6.67% | 0 |
| Feb. 2030 | 98.5 | 6.81% | -1 |