
Discover today’s performance of BLOM indices, the closing prices of Lebanese stocks and Eurobonds, as well as the exchange rate of major currencies against the LBP.
BLOM Stock Index (BSI): Today’s Performance
| Last | Previous | % Change | Y-t-D Change | |
| BSI | 1,164.93 | 1,163.62 | 0.11% | -3.94% |
| High | 1,165.32 | 1,169.71 | ||
| Low | 1,161.25 | 1,161.20 | ||
| Volume | 129,121 | 114,307 | 12.96% | |
| Val ($) | 2,099,501 | 1,059,471 | 98.17% |
BLOM Preferred Shares Index (BPSI): Today’s Performance
| Last | Previous | Change | |
| BPSI | 104.71 | 104.74 | -0.03% |
| Volume | 27,280 | 9,327 | |
| Value | 1,206,721 | 454,397 |
Lebanese Stocks: Today’s Trades and Closing Prices
| Last Price ($) | % Change | Volume | Value | VWAP ($) | |
| Solidere A | 8.93 | 2.76% | 31,146 | 270,521 | 8.69 |
| Solidere B | 8.90 | 4.71% | 3,484 | 30,953 | 8.88 |
| Bank Audi Preferred H | 100.40 | – | 120 | 12,048 | 100.40 |
| Bank of Beirut Pref H | 25.15 | – | 20,400 | 513,060 | 25.15 |
| Byblos Bank | 1.61 | -3.01% | 15,334 | 24,751 | 1.61 |
| Byblos Bank Preferred 2008 | 100.80 | -0.10% | 6,000 | 604,979 | 100.80 |
| Byblos Bank Preferred 2009 | 100.80 | -0.20% | 760 | 76,634 | 10080.00% |
| BLOM Bank Listed | 10.72 | 0.19% | 35,000 | 375,150 | 10.72 |
| BLOM GDR | 11.70 | – | 3,418 | 39,991 | 11.70 |
| HOLCIM | 11.25 | -5.46% | 13,459 | 151,414 | 11.25 |
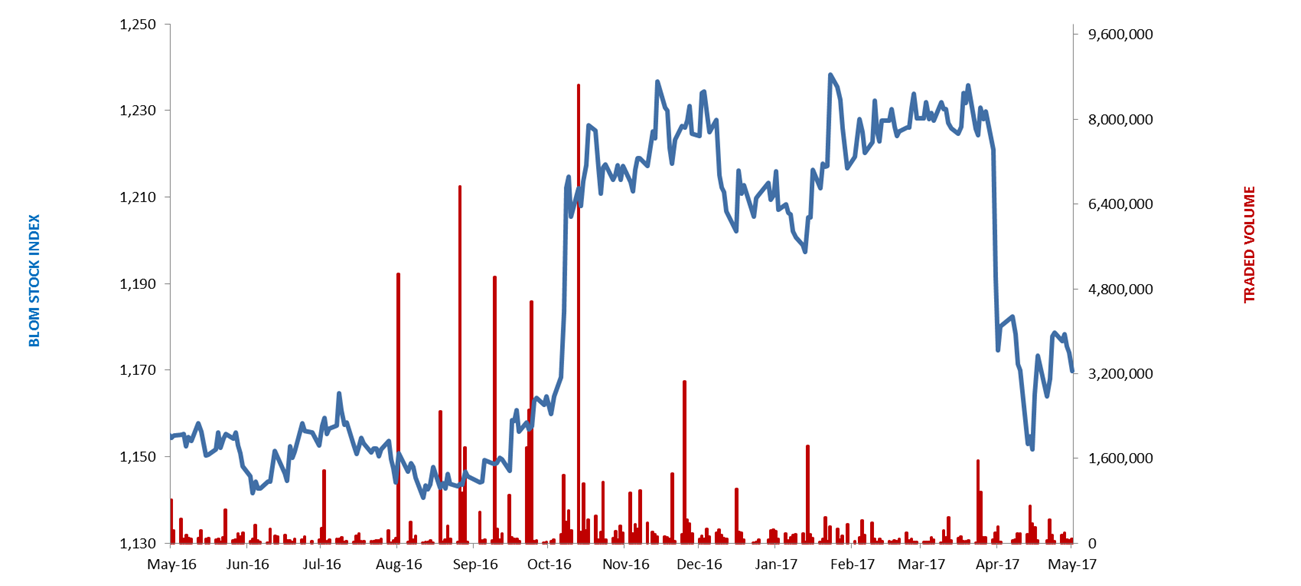
The BLOM Stock Index
Lebanese Global Depository Receipts: Last session’s Performance
| GDRs | Last Price ($) | Previous Price ($) | % Change | Volume | Value ($) |
| BLOM GDR | 11.70 | 11.70 | – | 2,565 | 30,011 |
| Audi GDR | 6.35 | 6.35 | – | 15,000 | 95,250 |
| Byblos GDR | 82.00 | 82.00 | – | – | – |
| Solidere GDR | 8.82 | 9.12 | -3.29% | 1,086 | 9,579 |
Source: Reuters
Closing Date: 15 May 2017
BLOM BOND INDEX: Last Session’s Performance
| Last | Previous | Change | Y-t-D Change | ||
| BBI | 106.37 | 106.42 | -0.05% | 4.39% | |
| Weighted Yield | 5.785% | 5.772% | 1.27 | bps | |
| Duration (Years) | 5.35 | 5.36 | |||
| 5Y Bond Yield | 5.49% | 5.49% | 0 | bps | |
| 5Y Spread* | 363 | 364 | -1 | bps | |
| 10Y Bond Yield | 6.52% | 6.53% | -1 | bps | |
| 10Y Spread* | 418 | 420 | -2 | bps | |
*between Lebanese Eurobonds and US Treasuries
Closing Date: 15 May 2017
Lebanese Eurobonds: Last Sessions’ Prices and Yields
| 12/06/2018 | 101.20 | 4.00% | 0 |
| 12/11/2018 | 101.50 | 4.10% | -1 |
| 23/04/2019 | 101.38 | 4.74% | 6 |
| 20/05/2019 | 102.38 | 4.75% | 5 |
| 28/11/2019 | 101.38 | 4.86% | 5 |
| 09/03/2020 | 103.38 | 5.07% | 4 |
| 14/04/2020 | 101.80 | 5.13% | -2 |
| 19/06/2020 | 102.70 | 5.19% | 1 |
| 12/04/2021 | 110.25 | 5.31% | -1 |
| 04/10/2022 | 102.50 | 5.55% | 0 |
| 27/01/2023 | 101.88 | 5.61% | 0 |
| 22/04/2024 | 103.25 | 6.07% | 0 |
| 04/11/2024 | 100.63 | 6.14% | 2 |
| 03/12/2024 | 104.75 | 6.20% | 4 |
| 26/02/2025 | 99.75 | 6.24% | 4 |
| 12/06/2025 | 99.75 | 6.29% | 4 |
| 28/11/2026 | 101.25 | 6.42% | 0 |
| 23/03/2027 | 102.38 | 6.52% | 0 |
| 29/11/2027 | 101.50 | 6.55% | 0 |
| 03/11/2028 | 100.50 | 6.59% | -2 |
| 26/02/2030 | 99.88 | 6.66% | 0 |
| 22/04/2031 | 101.25 | 6.86% | 0 |
| 23/03/2032 | 101.00 | 6.89% | 1 |
| 02/11/2035 | 100.25 | 7.03% | 0 |
| 23/03/2037 | 101.00 | 7.15% | 1 |
| Last Price | Previous | % Change | Y-t-D | |
| $/LBP | 1,514.25 | 1,514.25 | – | |
| €/LBP | 1,670.61 | 1,654.18 | 0.99% | |
| £/LBP | 1,943.92 | 1,943.62 | 0.02% | |
| NEER | 114.93 | 115.37 | -0.38% | -2.94% |
Closing Date: 16 May 2017