
Discover today’s performance of BLOM indices, the closing prices of Lebanese stocks and Eurobonds, as well as the exchange rate of major currencies against the LBP.
BLOM Stock Index (BSI): Today’s Performance
| Last | Previous | % Change | Y-t-D Change | |
| BSI | 1,160.36 | 1,163.92 | -0.31% | -4.32% |
| High | 1,164.89 | 1,164.00 | ||
| Low | 1,158.20 | 1,160.27 | ||
| Volume | 25,793 | 226,126 | -88.59% | |
| Val ($) | 211,643 | 1,743,335 | -87.86% |
BLOM Preferred Shares Index (BPSI): Today’s Performance
| Last | Previous | Change | |
| BPSI | 104.69 | 104.69 | 0.00% |
| Volume | – | 36,925 | |
| Value | – | 1,001,947 |
Lebanese Stocks: Today’s Trades and Closing Prices
| Last Price ($) | % Change | Volume | VWAP ($) | |
| Solidere A | 8.69 | -2.24% | 8,481 | 8.69 |
| Solidere B | 8.61 | -2.15% | 2,622 | 8.61 |
| Bank Audi | 6.10 | -1.77% | 390 | 6.10 |
| Byblos Bank | 1.68 | 1.81% | 5,500 | 1.68 |
| BLOM Bank Listed | 10.71 | 0.09% | 3,000 | 10.71 |
| HOLCIM | 12.36 | 6.18% | 5,800 | 12.36 |
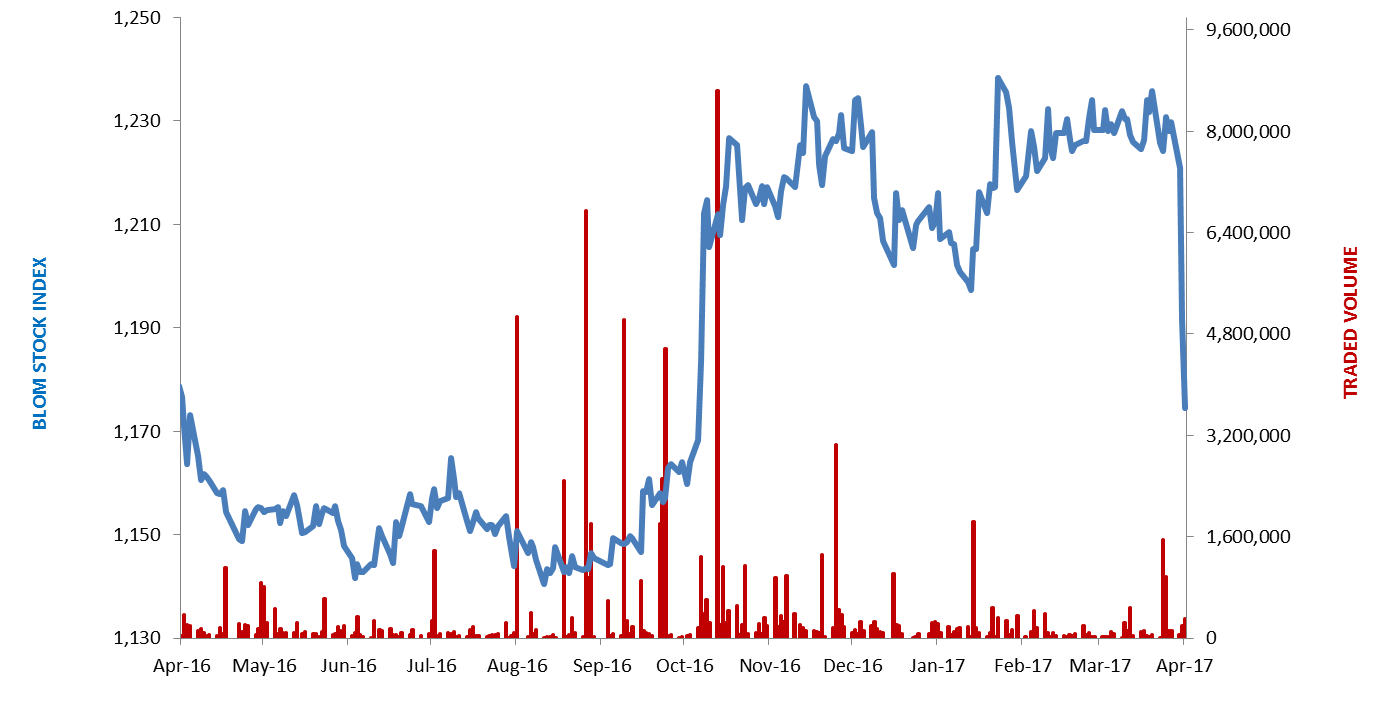
The BLOM Stock Index
Lebanese Global Depository Receipts: Last session’s Performance
| GDRs | Last Price ($) | Previous Price ($) | % Change | Volume | Value ($) |
| BLOM GDR | 11.65 | 11.60 | 0.43% | 2,918 | 33,995 |
| Audi GDR | 6.36 | 6.35 | 0.16% | 66,716 | 424,314 |
| Byblos GDR | 82.00 | 82.00 | – | – | – |
| Solidere GDR | 9.00 | 8.82 | 2.04% | 172 | 1,548 |
Source: Reuters
Closing Date: 17 May 2017
BLOM BOND INDEX: Last Session’s Performance
| Last | Previous | Change | Y-t-D Change | ||
| BBI | 106.37 | 106.42 | -0.05% | 4.39% | |
| Weighted Yield | 5.785% | 5.772% | 1.27 | bps | |
| Duration (Years) | 5.35 | 5.36 | |||
| 5Y Bond Yield | 5.49% | 5.49% | 0 | bps | |
| 5Y Spread* | 363 | 364 | -1 | bps | |
| 10Y Bond Yield | 6.52% | 6.53% | -1 | bps | |
| 10Y Spread* | 418 | 420 | -2 | bps | |
*between Lebanese Eurobonds and US Treasuries
Closing Date: 15 May 2017
Lebanese Eurobonds: Last Sessions’ Prices and Yields
| 12/06/2018 | 101.15 | 4.04% | 4 |
| 12/11/2018 | 101.45 | 4.13% | 3 |
| 23/04/2019 | 101.38 | 4.74% | 0 |
| 20/05/2019 | 102.38 | 4.74% | 0 |
| 28/11/2019 | 101.38 | 4.86% | 0 |
| 09/03/2020 | 103.38 | 5.07% | 0 |
| 14/04/2020 | 101.75 | 5.14% | 2 |
| 19/06/2020 | 102.63 | 5.22% | 2 |
| 12/04/2021 | 109.88 | 5.41% | 10 |
| 04/10/2022 | 102.50 | 5.55% | 0 |
| 27/01/2023 | 101.75 | 5.63% | 3 |
| 22/04/2024 | 103.13 | 6.09% | 2 |
| 04/11/2024 | 100.50 | 6.16% | 2 |
| 03/12/2024 | 104.75 | 6.20% | 0 |
| 26/02/2025 | 99.75 | 6.24% | 0 |
| 12/06/2025 | 99.75 | 6.29% | 0 |
| 28/11/2026 | 101.25 | 6.42% | 0 |
| 23/03/2027 | 102.25 | 6.54% | 2 |
| 29/11/2027 | 101.38 | 6.57% | 2 |
| 03/11/2028 | 100.38 | 6.60% | 1 |
| 26/02/2030 | 99.75 | 6.68% | 2 |
| 22/04/2031 | 101.38 | 6.84% | -1 |
| 23/03/2032 | 101.25 | 6.86% | -3 |
| 02/11/2035 | 100.25 | 7.03% | 0 |
| 23/03/2037 | 100.88 | 7.16% | 1 |
| Last Price | Previous | % Change | Y-t-D | |
| $/LBP | 1,514.25 | 1,514.25 | – | |
| €/LBP | 1,674.83 | 1,682.07 | -0.43% | |
| £/LBP | 1,962.61 | 1,955.08 | 0.39% | |
| NEER | 115.06 | 114.86 | 0.18% | -2.82% |
Closing Date: 18 May 2017