
Discover today’s performance of BLOM indices, the closing prices of Lebanese stocks and Eurobonds, as well as the exchange rate of major currencies against the LBP.
BLOM Stock Index (BSI): Today’s Performance
| Last | Previous | % Change | Y-t-D Change | |
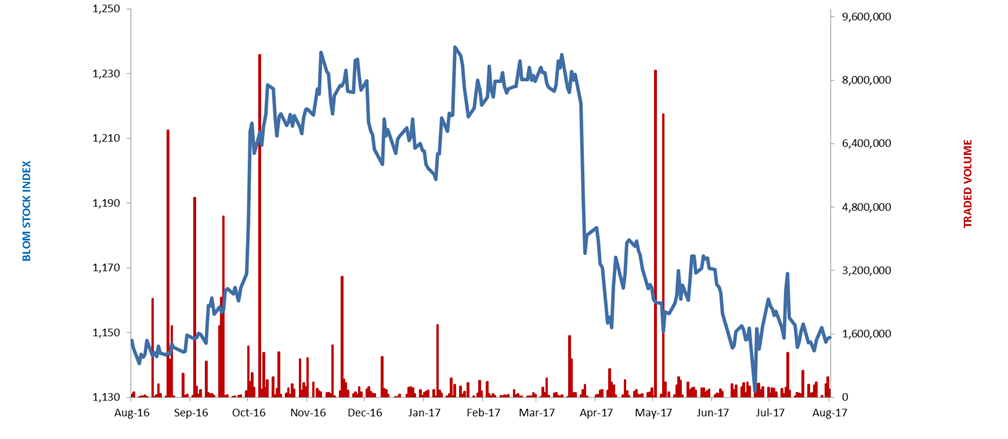
| BSI | 1,152.51 | 1,153.55 | -0.09% | -4.97% |
| High | 1,152.79 | 1,153.63 | ||
| Low | 1,150.73 | 1,150.36 | ||
| Volume | 569,173 | 427,377 | 33.18% | |
| Val ($) | 4,254,160 | 3,462,430 | 22.87% |
BLOM Preferred Shares Index (BPSI): Today’s Performance
| Last | Previous | Change | |
| BPSI | 104.94 | 104.94 | 0.00% |
| Volume | 2,416 | – | |
| Value | 245,032 | – |
Lebanese Stocks: Today’s Trades and Closing Prices
| Last Price ($) | % Change | Volume | VWAP ($) | |
| Solidere A | 8.12 | 1.00% | 414,701 | 8.02 |
| Solidere B | 7.89 | -2.47% | 53,675 | 8 |
| BLC Listed Shares | 0.93 | -6.06% | 37.00 | 0.93 |
| BLC Pref D | 100 | – | 700 | 100 |
| Bank Audi GDR | 6 | – | 5,000 | 6 |
| BoB Listed Shares | 18.8 | – | 4,000 | 18.8 |
| Byblos Bank | 1.61 | – | 73,334 | 1.61 |
| Byblos Bank Pref 2009 | 102 | – | 1,716 | 102 |
| HOLCIM | 12.26 | – | 10 | 12.26 |
| CB(N) | 1.82 | 12.35% | 16,000 | 1.82 |
The BLOM Stock Index
Lebanese Global Depository Receipts: Last session’s Performance
| GDRs | Last Price ($) | Previous Price ($) | % Change | Volume | Value ($) |
| BLOM GDR | 12.45 | 12.45 | 0.0% | – | – |
| Audi GDR | 5.93 | 6 | -1.2% | 14,670 | 86,993 |
| Byblos GDR | 80 | 80 | 0.0% | – | – |
Source: London Stock Exchange
Closing Date: 22 Aug 2017
BLOM BOND INDEX: Last Session’s Performance
| Last | Previous | Change | Y-t-D Change | ||
| BBI | 104.00 | 104.00 | 0.00% | 2.07% | |
| Weighted Yield | 6.316% | 6.316% | 0 | bps | |
| Duration (Years) | 5.24 | 5.24 | |||
| 5Y Bond Yield | 6.28% | 6.28% | 0 | bps | |
| 5Y Spread* | 448 | 452 | -4 | bps | |
| 10Y Bond Yield | 6.87% | 6.87% | 0 | bps | |
| 10Y Spread* | 465 | 469 | -4 | bps | |
*between Lebanese Eurobonds and US Treasuries
Closing Date: 22 August 2017
Lebanese Eurobonds: Last Sessions’ Prices and Yields
| Price | Yield | Yield Change | |
| 12/11/2018 | 100.50 | 4.72% | 0 |
| 23/04/2019 | 100.38 | 5.25% | 0 |
| 20/05/2019 | 101.25 | 5.24% | 0 |
| 28/11/2019 | 100.25 | 5.33% | 0 |
| 09/03/2020 | 102.00 | 5.52% | 0 |
| 14/04/2020 | 100.35 | 5.65% | 0 |
| 19/06/2020 | 101.13 | 5.71% | 0 |
| 12/04/2021 | 106.75 | 6.15% | 0 |
| 04/10/2022 | 99.13 | 6.30% | 0 |
| 27/01/2023 | 98.13 | 6.41% | 0 |
| 22/04/2024 | 100.38 | 6.58% | 0 |
| 04/11/2024 | 98.13 | 6.58% | 0 |
| 03/12/2024 | 102.25 | 6.60% | 0 |
| 26/02/2025 | 97.63 | 6.60% | 0 |
| 12/06/2025 | 97.63 | 6.64% | 0 |
| 28/11/2026 | 99.00 | 6.74% | 0 |
| 23/03/2027 | 100.00 | 6.85% | 0 |
| 29/11/2027 | 99.00 | 6.89% | 0 |
| 03/11/2028 | 97.38 | 6.99% | 0 |
| 26/02/2030 | 97.00 | 7.01% | 0 |
| 22/04/2031 | 99.50 | 7.06% | 0 |
| 23/03/2032 | 99.13 | 7.10% | 0 |
| 02/11/2035 | 98.25 | 7.22% | 0 |
| 23/03/2037 | 99.25 | 7.32% | 0 |
| Last Price | Previous | % Change | Y-t-D | |
| $/LBP | 1,514.00 | 1,514.00 | – | |
| €/LBP | 1,778.40 | 1,773.12 | 0.30% | |
| £/LBP | 1,931.86 | 1,933.07 | -0.06% | |
| NEER | 111.68 | 111.80 | -0.11% | -5.68% |
Closing Date: 23 August 2017