Discover today’s performance of BLOM indices, the closing prices of Lebanese stocks and Eurobonds, as well as the exchange rate of major currencies against the LBP.
BLOM Stock Index (BSI) – today’s performance
| Last | Previous | % Change | Y-t-D Change | |
| BSI | 844.15 | 941.46 | -10.34% | -13.58% |
| High | 854.60 | 854.60 | ||
| Low | 844.10 | 840.80 | ` | |
| Volume | 56,673 | 81,767 | ||
| Val ($) | 506,448 | 480,070 |
I): BLOM preferred Shares Index (BPSI): today’s Performance
| Last | Previous | Change | |
| BPSI | 82.91 | 82.92 | -0.01% |
| Volume | 2,336 | 86 | |
| Value | 174,728 | 6,450 |
Lebanese Stocks: today’s Trades and Closing Prices
| Last Price ($) | % Change | Volume | VWAP ($) | |
| Solidere A | 6.15 | 3.54% | 44,102 | 6.02 |
| Solidere B | 6.52 | 6.89% | 9,863 | 6.32 |
| Bank Audi Pref H | 74.8 | -0.27% | 2,336 | 74.80 |
| BLOM GDR | 7.59 | 0.13% | 172 | 7.59 |
| HOLCIM | 11.8 | -8.95% | 200 | 11.80 |
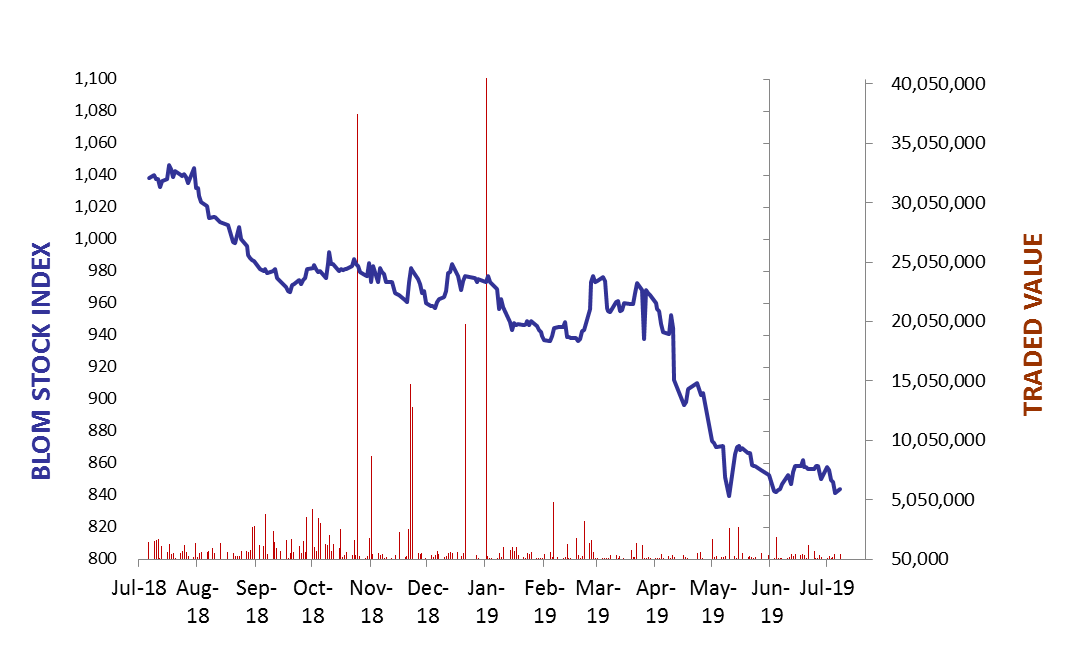
The BLOM Stock Index
Lebanese Global Depository Receipts: Last session’s Performance
| GDRs | Last Price ($) | Previous Price ($) | % Change | Volume | Value ($) |
| BLOM GDR | 7.5 | 7.5 | 0.00% | – | – |
| Audi GDR | 3.96 | 3.96 | 0.00% | – | – |
| Byblos GDR | 77 | 77 | 0.00% | – | – |
Closing Date: 11 July 2019
Source: London Stock Exchange
BLOM BOND INDEX: Last Session’s Performance
| Last | Previous | Change | Y-t-D Change | ||
| BBI | 88.73 | 88.57 | 0.17% | -12.20% | |
| Weighted Yield | 11.21% | 11.23% | -3 | bps | |
| Duration (Years) | 5.10 | 5.10 | |||
| 5Y Bond Yield | 11.80% | 11.83% | -3 | bps | |
| 5Y Spread* | 999 | 999 | 0 | bps | |
| 10Y Bond Yield | 10.96% | 11.00% | -4 | bps | |
| 10Y Spread* | 898 | 901 | -3 | bps | |
*between Lebanese Eurobonds and US Treasuries
Closing Date: 12 July 2019
Lebanese Eurobonds: Last Sessions’ Prices and Yields
| Price | Yield | Yield Change | |
| 12/04/2021 | 93.72 | 12.33% | 0 |
| 04/10/2022 | 85.04 | 11.80% | 2 |
| 27/01/2023 | 83.46 | 11.85% | -3 |
| 22/04/2024 | 81.38 | 11.86% | 2 |
| 04/11/2024 | 79.17 | 11.61% | 4 |
| 03/12/2024 | 81.77 | 11.64% | -4 |
| 26/02/2025 | 79.13 | 11.32% | -2 |
| 12/06/2025 | 79.71 | 11.00% | -1 |
| 28/11/2026 | 78.17 | 10.99% | -6 |
| 23/03/2027 | 78.33 | 11.11% | -6 |
| 29/11/2027 | 77.29 | 10.96% | -3 |
| 03/11/2028 | 77.38 | 10.52% | -4 |
| 26/02/2030 | 75.92 | 10.46% | -9 |
| 22/04/2031 | 76.28 | 10.56% | -1 |
| 23/03/2032 | 77.29 | 10.23% | -4 |
| 02/11/2035 | 75.21 | 10.20% | -3 |
| 23/03/2037 | 76.00 | 10.22% | -3 |
Lebanese Forex Market
| Last Price | Previous | % Change | Y-t-D | |
| $/LBP | 1,514.25 | 1,514.25 | – | |
| €/LBP | 1,698.35 | 1,698.80 | -0.03% | |
| £/LBP | 1,889.35 | 1,895.38 | -0.32% | |
| NEER | 118.29 | 118.03 | 0.22% |
Closing Date: 15 July 2019