Discover today’s performance of BLOM indices, the closing prices of Lebanese stocks and Eurobonds, as well as the exchange rate of major currencies against the LBP.
BLOM Stock Index (BSI) – today’s performance
| Last | Previous | % Change | Y-t-D Change | |
| BSI | 763.81 | 765.71 | -0.25% | -21.80% |
| High | 770.20 | 770.20 | ||
| Low | 762.20 | 764.30 | ` | |
| Volume | 498,181 | 53,752 | ||
| Val ($) | 1,826,406 | 302,864 |
I): BLOM preferred Shares Index (BPSI): today’s Performance
| Last | Previous | Change | |
| BPSI | 78.13 | 78.01 | 0.15% |
| Volume | 208 | ||
| Value | 13,104 |
Lebanese Stocks: today’s Trades and Closing Prices
| Last Price ($) | % Change | Volume | VWAP ($) | |
| Solidere A | 5.45 | -1.80% | 15,127 | 5.45 |
| Solidere B | 5.55 | 2.21% | 1,554 | 5.54 |
| Bank Audi GDR | 3.59 | -4.59% | 464,279 | 3.53 |
| Byblos Bank – Listed Shares | 1.09 | -0.91% | 4,013 | 1.09 |
| Byblos Bank Pref 2009 | 63 | 5.00% | 208 | 63 |
| BLOM GDR | 6.07 | 0.83% | 13,000 | 6.07 |
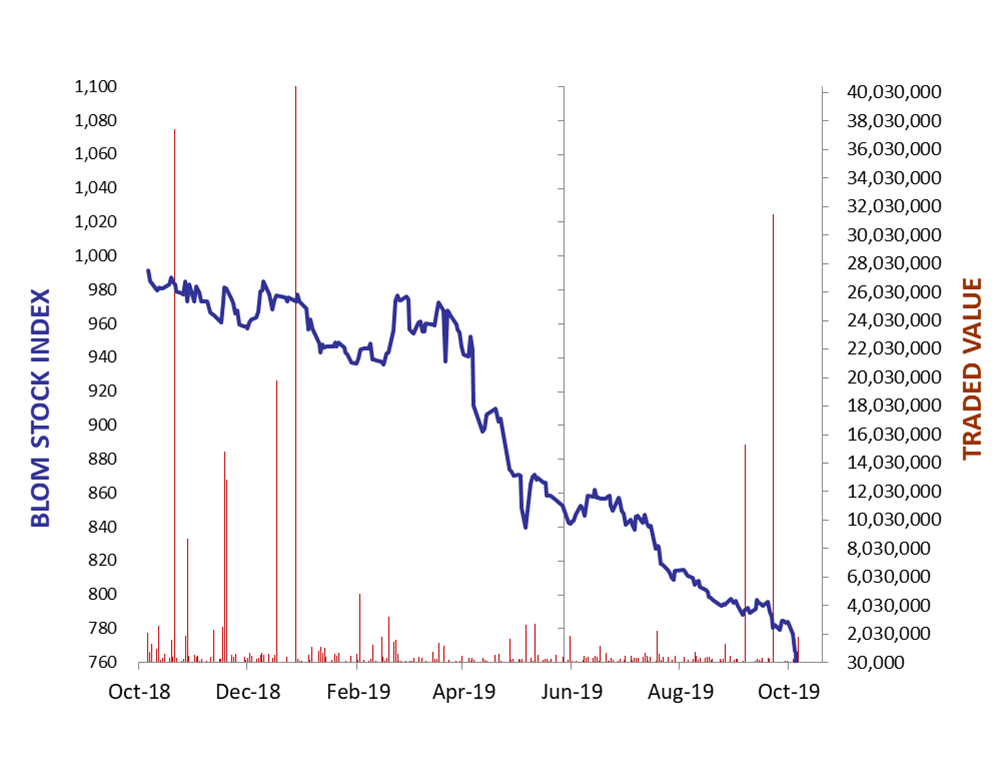
The BLOM Stock Index
Lebanese Global Depository Receipts: Last session’s Performance
| GDRs | Last Price ($) | Previous Price ($) | % Change | Volume | Value ($) |
| BLOM GDR | 5.85 | 6.00 | -2.50% | 6,208 | 37,004 |
| Audi GDR | 3.08 | 3.08 | 0.00% | ||
| Byblos GDR | 70 | 70 | 0.00% | – |
Closing Date: 15 Oct. 2019
Source: London Stock Exchange
BLOM BOND INDEX: Last Session’s Performance
| Last | Previous | Change | Y-t-D Change | ||
| BBI | 78.03 | 77.66 | 0.47% | -22.79% | |
| Weighted Yield | 14.67% | 14.82% | -15 | bps | |
| Duration (Years) | 4.81 | 4.81 | |||
| 5Y Bond Yield | 17.50% | 17.55% | -5 | bps | |
| 5Y Spread* | 1,593 | 1,595 | -2 | bps | |
| 10Y Bond Yield | 13.42% | 13.51% | -9 | bps | |
| 10Y Spread* | 1,177 | 1,183 | -6 | bps | |
*between Lebanese Eurobonds and US Treasuries
Closing Date: 16 Oct. 2019
Lebanese Eurobonds: Last Sessions’ Prices and Yields
| Price | Yield | Yield Change | |
| 12/04/2021 | 87.50 | 18.21% | -62 |
| 04/10/2022 | 74.27 | 17.60% | -2 |
| 27/01/2023 | 72.50 | 17.33% | -13 |
| 22/04/2024 | 70.70 | 16.01% | -12 |
| 04/11/2024 | 69.57 | 15.07% | -7 |
| 03/12/2024 | 68.93 | 16.12% | 30 |
| 26/02/2025 | 68.86 | 14.81% | -9 |
| 12/06/2025 | 69.55 | 14.27% | -16 |
| 28/11/2026 | 67.95 | 13.81% | -13 |
| 23/03/2027 | 67.77 | 13.95% | -5 |
| 29/11/2027 | 67.57 | 13.43% | 1 |
| 03/11/2028 | 68.00 | 12.70% | -8 |
| 26/02/2030 | 68.18 | 12.12% | -7 |
| 22/04/2031 | 68.09 | 12.24% | -13 |
| 23/03/2032 | 68.71 | 11.88% | -10 |
| 02/11/2035 | 68.95 | 11.28% | -10 |
| 23/03/2037 | 68.98 | 11.38% | -8 |
Lebanese Forex Market
| Last Price | Previous | % Change | Y-t-D | |
| $/LBP | 1,514.25 | 1,514.25 | – | |
| €/LBP | 1,676.19 | 1,669.10 | 0.42% | |
| £/LBP | 1,939.10 | 1,934.42 | 0.24% | |
| NEER | 118.63 | 119.04 | -0.34% |
Closing Date: 17 Oct. 2019