Discover today’s performance of BLOM indices, the closing prices of Lebanese stocks and Eurobonds, as well as the exchange rate of major currencies against the LBP.
BLOM Stock Index (BSI) – Today’s performance
| Last | Previous | % Change | Y-t-D Change | |
| BSI | 619.31 | 623.72 | -0.71% | -21.16% |
| High | 926.20 | 634.90 | ||
| Low | 619.30 | 623.70 | ||
| Volume | 73,553 | 164,741 | ||
| Val ($) | 471,714 | 1,345,516 |
I): BLOM preferred Shares Index (BPSI): today’s Performance
| Last | Previous | Change | |
| BPSI | 74.67 | 74.67 | 0.00% |
| Volume | – | ||
| Value | – |
Lebanese Stocks: today’s Trades and Closing Prices
| Last Price ($) | % Change | Volume | VWAP ($) | |
| Solidere A | 8.49 | 0.00% | 28,198 | 8.5 |
| Solidere B | 8.6 | 1.42% | 20,808 | 8.5 |
| Bank Audi | 1.99 | 0.00% | 17,477 | 2.00 |
| Byblos Bank – | 1.00 | 0.00% | 100 | 1.00 |
| Blom Listed shares | 3.10 | -9.88% | 3,485 | 3.10 |
| Blom GDR | 2.80 | 12.00% | 3,485 | 2.80 |
Closing Date: 07 February 2020
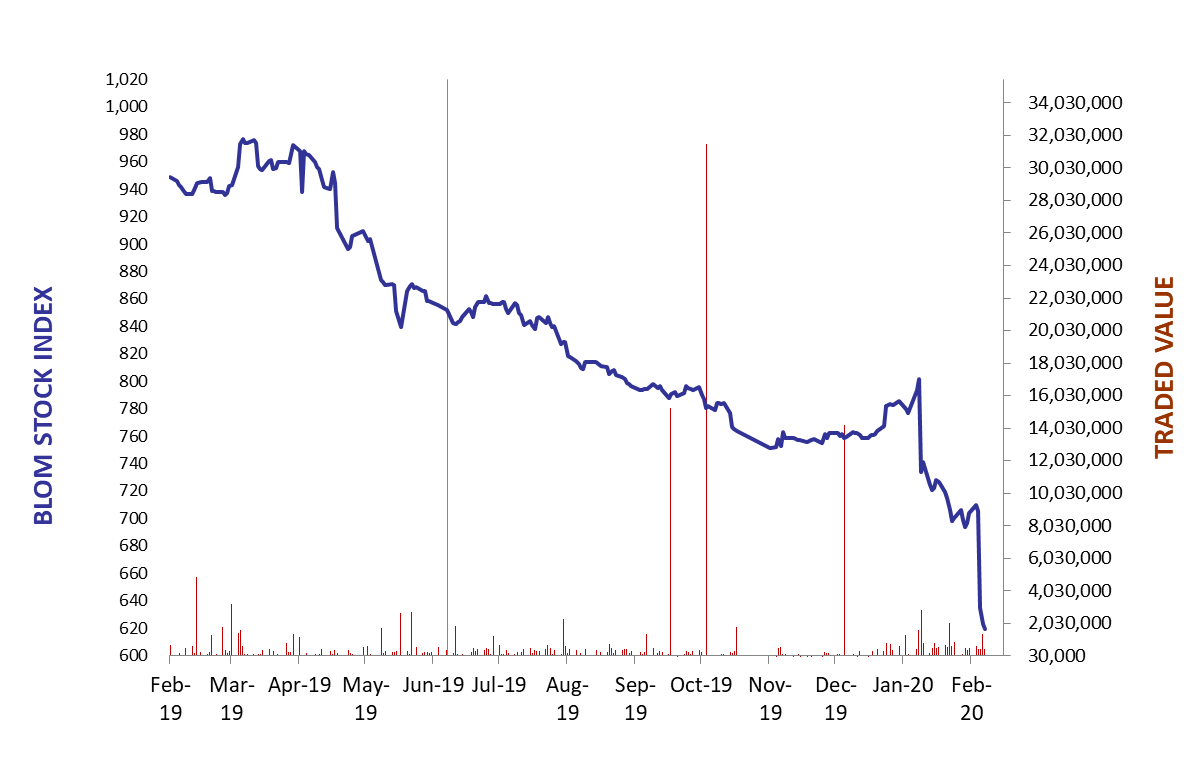
The BLOM Stock Index
Lebanese Global Depository Receipts: Last Session’s Performance
| GDRs | Last Price ($) | Previous Price ($) | % Change | Volume | Value ($) |
| BLOM GDR | 2.50 | 2.50 | 0.00% | – | – |
| Audi GDR | 1.4 | 1.4 | 0.00% | 1,250 | 1,750 |
| Byblos GDR | 70 | 70 | 0.00% | – | – |
Closing Date: 06th February 2020
Source: London Stock Exchange
BLOM BOND INDEX: Last Session’s Performance
| Last | Previous | Change | Y-t-D Change | ||
| BBI | 43.13 | 45.74 | -5.72% | -14.78% | |
| Weighted Yield | 36.72% | 34.19% | 253 | bps | |
| Duration (Years) | 3.80 | 3.88 | |||
| 5Y Bond Yield | 47.20% | 44.20% | 300 | bps | |
| 5Y Spread* | 4,577 | 4,277 | 300 | bps | |
| 10Y Bond Yield | 25.76% | 24.60% | 116 | bps | |
| 10Y Spread* | 2,420 | 2,303 | 117 | bps | |
*between Lebanese Eurobonds and US Treasuries
Closing Date: 06 February 2020
Lebanese Eurobonds: Last Sessions’ Prices and Yields
| Price | Yield | Yield Change | |
| 12/04/2021 | 50.58 | 80.07% | 838 |
| 04/10/2022 | 40.14 | 48.39% | 337 |
| 27/01/2023 | 38.88 | 45.46% | 305 |
| 22/04/2024 | 38.79 | 35.91% | 176 |
| 04/11/2024 | 38.96 | 32.22% | 142 |
| 03/12/2024 | 38.27 | 33.90% | 132 |
| 26/02/2025 | 38.04 | 31.48% | 154 |
| 12/06/2025 | 38.57 | 30.01% | 151 |
| 28/11/2026 | 37.79 | 27.06% | 122 |
| 23/03/2027 | 37.66 | 26.98% | 125 |
| 29/11/2027 | 37.36 | 25.73% | 128 |
| 03/11/2028 | 37.52 | 24.11% | 114 |
| 26/02/2030 | 37.07 | 22.90% | 121 |
| 22/04/2031 | 37.00 | 22.78% | 122 |
| 23/03/2032 | 37.01 | 22.12% | 122 |
| 02/11/2035 | 37.16 | 20.65% | 106 |
| 23/03/2037 | 37.01 | 20.83% | 115 |
Lebanese Forex Market
| Last Price | Previous | % Change | Y-t-D | |
| $/LBP | 1,514.25 | 1,514.25 | – | |
| €/LBP | 1,651.62 | 1,655.69 | -0.25% | |
| £/LBP | 1,949.05 | 1,949.35 | -0.02% | |
| NEER | 119.09 | 118.69 | 0.34% |
Closing Date: 07 February 2020