Discover today’s performance of BLOM indices, the closing prices of Lebanese stocks and Eurobonds, as well as the exchange rate of major currencies against the LBP.
BLOM Stock Index (BSI) – today’s performance
| Last | Previous | % Change | Y-t-D Change | |
| BSI | 600.63 | 607.13 | -1.07% | -23.54% |
| High | 601.20 | 612.23 | ||
| Low | 600.00 | 603.70 | ||
| Volume | 121,698 | 115,414 | ||
| Val ($) | 1,484,190 | 1,531,719 |
I): BLOM preferred Shares Index (BPSI): today’s Performance
| Last | Previous | Change | |
| BPSI | 62.69 | 62.69 | 0.00% |
| Volume | – | – | |
| Value | – | – |
Lebanese Stocks: today’s Trades and Closing Prices
| Last Price ($) | % Change | Volume | VWAP ($) | |
| Solidere A | 13.50 | 1.12% | 94,278 | 13.51 |
| Solidere B | 13.50 | 0.37% | 14,940 | 13.50 |
| Audi Bank Listed Shares | 0.88 | 0.00% | 1,480 | 0.90 |
| Byblos Listed Shares | 0.45 | -25.00% | 10,000 | 0.5 |
| CB(N) | 3.80 | 0.00% | 1,000 | 3.8 |
Closing Date: July 2, 2020
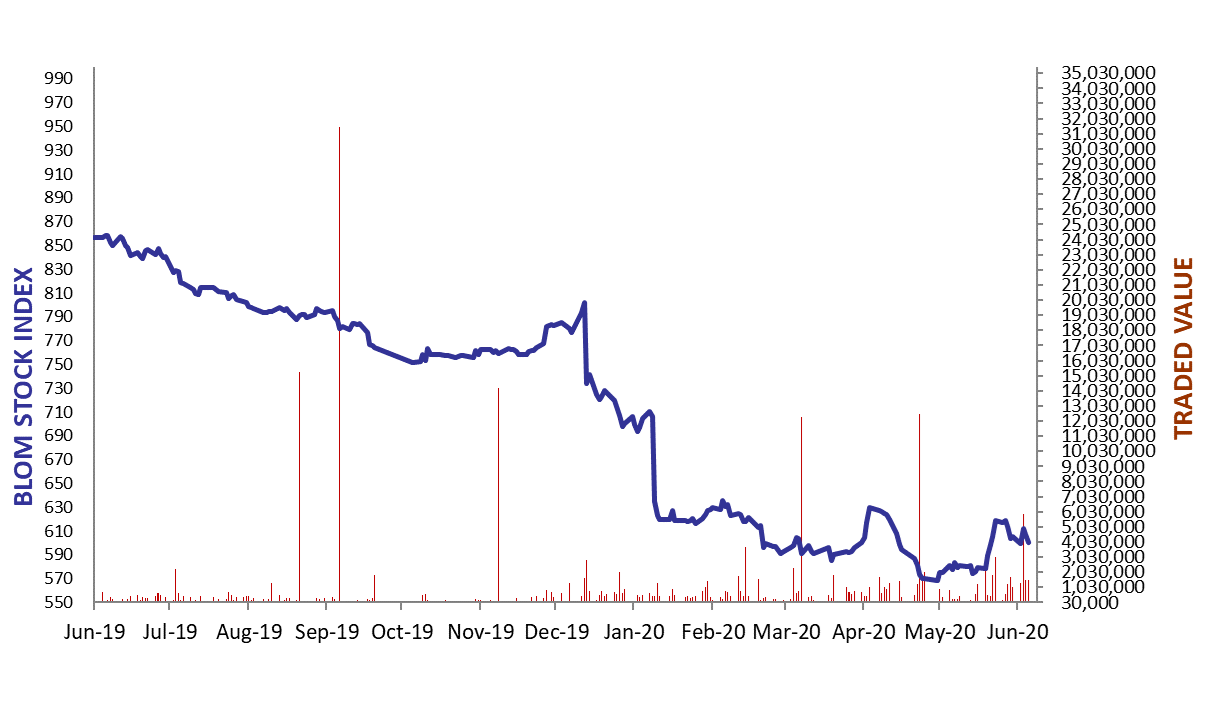
The BLOM Stock Index
Lebanese Global Depository Receipts: Last Session’s Performance
| Global Depository Receipts (GDRs) | Last Price ($) | Previous Price ($) | % Change | Volume | Value ($) |
| BLOM GDR | 1.30 | 1.40 | -7.14% | 270 | 351 |
| Audi GDR | 0.41 | 0.41 | 0.00% | – | – |
| Byblos GDR | 70 | 70 | 0.00% | – | – |
Closing Date: June 30, 2020
Source: London Stock Exchange
BLOM BOND INDEX: Last Session’s Performance
| Last | Previous | Change | Y-t-D Change | ||
| BBI | 16.24 | 16.30 | -0.36% | -67.88% | |
| Weighted Yield | 62.36% | 62.15% | 21 | bps | |
| Duration (Years) | 2.79 | 2.80 | |||
| 5Y Bond Yield | 109.50% | 109.00% | 50 | bps | |
| 5Y Spread* | 10,933 | 10,884 | 49 | bps | |
| 10Y Bond Yield | 49.50% | 49.00% | 50 | bps | |
| 10Y Spread* | 4,919 | 4,871 | 48 | bps | |
*spread between Lebanese Eurobonds and US Treasuries
Closing Date: July 1, 2020
Lebanese Eurobonds: Last Sessions’ Prices and Yields
| Price | Yield | Yield Change | |
| 10/4/2022 | 17.88 | 112.40% | 14 |
| 1/27/2023 | 17.21 | 101.55% | 119 |
| 4/22/2024 | 17.00 | 74.41% | 4 |
| 11/4/2024 | 17.08 | 65.74% | 103 |
| 12/3/2024 | 16.75 | 68.61% | (21) |
| 2/26/2025 | 17.33 | 61.70% | 3 |
| 6/12/2025 | 17.98 | 57.88% | 2 |
| 11/28/2026 | 17.13 | 52.06% | 1 |
| 3/23/2027 | 16.75 | 52.44% | 1 |
| 11/29/2027 | 16.92 | 49.33% | 45 |
| 11/3/2028 | 16.92 | 46.36% | 43 |
| 2/26/2030 | 16.75 | 44.25% | 1 |
| 4/22/2031 | 16.58 | 44.86% | 71 |
| 3/23/2032 | 17.13 | 42.87% | 0 |
| 11/2/2035 | 17.25 | 41.32% | (0) |
| 3/23/2037 | 17.25 | 42.16% | 0 |
Lebanese Forex Market
| Last Price | Previous | % Change | Y-t-D | |
| $/LBP | 1,514.25 | 1,514.25 | – | |
| €/LBP | 1,701.21 | 1,706.19 | -0.29% | |
| £/LBP | 1,886.33 | 1,905.48 | -1.00% | |
| NEER | 128.96 | 129.46 | -0.39% |
Closing Date: July 2, 2020