Discover today’s performance of BLOM indices, the closing prices of Lebanese stocks and Eurobonds, as well as the exchange rate of major currencies against the LBP.
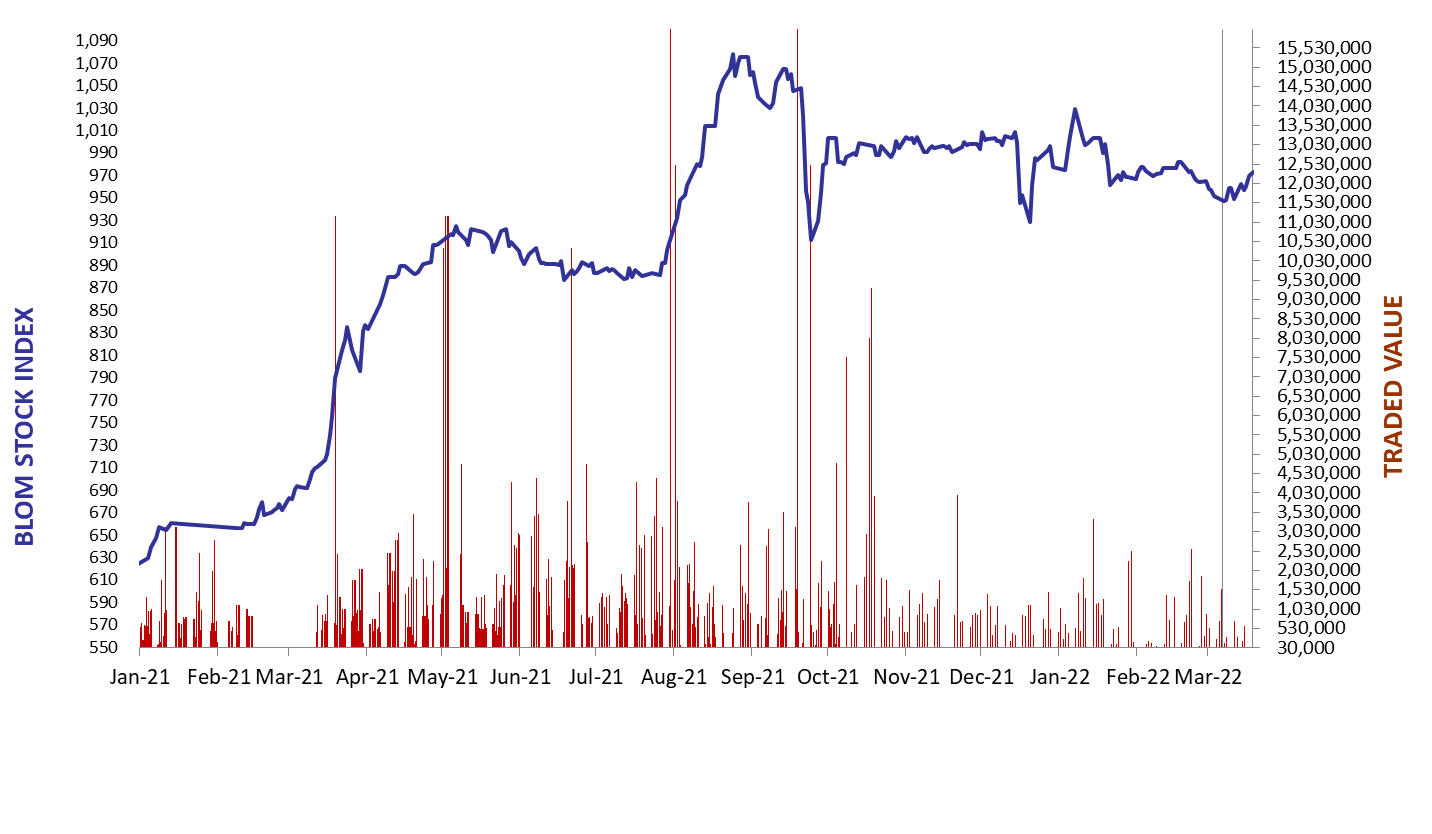
BLOM Stock Index (BSI) – today’s performance
| Last | Previous | % Change | Y-t-D Change | |
| BSI | 982.89 | 957.24 | 2.68% | -2.02% |
| High | 983.25 | 958.47 | ||
| Low | 981.25 | 956.35 | ||
| Volume | 7,044 | 17,066 | ||
| Val ($) | 231,078 | 528,627 |
I): BLOM preferred Shares Index (BPSI): today’s Performance
| Last | Previous | Change | |
| BPSI | 44.99 | 44.99 | 0.00% |
| Volume | |||
| Value |
Lebanese Stocks: today’s Trades and Closing Prices
|
Closing Date: March 22, 2022
The BLOM Stock Index
| Last | Previous | Change | Y-t-D Change | ||
| BBI | 11.90 | 11.77 | 1.16% | 7.99% | |
| Weighted Yield | 86.52% | 87.05% | -53 | bps | |
| Duration (Years) | 2.03 | 2.02 | |||
| 5Y Bond Yield | 77.80% | 78.60% | -80 | bps | |
| 5Y Spread* | 7,626 | 7,645 | -19 | bps | |
| 10Y Bond Yield | 60.89% | 61.00% | -11 | bps | |
| 10Y Spread* | 5,864 | 5,883 | -19 | bps | |
BLOM BOND INDEX: Last Session’s Performance
| Price | Yield | Yield Change | |
| 4/22/2024 | 11.46 | 166.95% | 3 |
| 11/4/2024 | 11.46 | 130.72% | (14) |
| 12/3/2024 | 11.35 | 131.10% | (44) |
| 2/26/2025 | 11.66 | 116.56% | (177) |
| 6/12/2025 | 11.65 | 106.77% | 6 |
| 11/28/2026 | 11.56 | 82.12% | (55) |
| 3/23/2027 | 11.47 | 81.09% | (76) |
| 11/29/2027 | 11.56 | 73.83% | (92) |
| 11/3/2028 | 11.46 | 68.44% | (60) |
| 2/26/2030 | 11.41 | 64.10% | (101) |
| 4/22/2031 | 11.12 | 65.57% | (11) |
| 3/23/2032 | 11.47 | 63.03% | (11) |
| 11/2/2035 | 11.50 | 61.18% | 11 |
| 3/23/2037 | 11.57 | 62.75% | 3 |
*spread between Lebanese Eurobonds and US Treasuries
Closing Date: March 21, 2022
Lebanese Forex Market
| Last Price | Previous | % Change | Y-t-D | |
| $/LBP | 1,514.25 | 1,514.25 | – | |
| €/LBP | 1,657.35 | 1,657.19 | 0.01% | |
| £/LBP | 1,992.92 | 1,993.22 | -0.02% | |
| NEER | 159.09 | 158.90 | 0.12% |
Closing Date: March 22, 2022