According to the Central Administration of Statistics (CAS), the Consumer Price Index (CPI) revealed that Lebanon’s monthly inflation rate jumped from 137.75% in August 2021 to 161.89% in August 2022. In fact, all sectors witnessed inflationary pressures throughout the years, amid the acute deterioration of the economic situation. Consequently, food price inflation in Lebanon is the second highest in the world, according to the World Bank, ranking behind Zimbabwe.
| Annual Inflation (%) | Aug 2018- 2019 | Aug 2019- 2020 | Aug 2020- 2021 | Aug 2021- 2022 |
| Food and non-alcoholic beverages | 0.58% | 367.19% | 290.40% | 198.11% |
| Clothing and footwear | 12.14% | 413.44% | 205.53% | 143.70% |
| Housing water, electricity, gas and other fuels | -0.49% | 12.18% | 47.42% | 99.89% |
| Health | -0.23% | 14.60% | 206.47% | 271.23% |
| Recreation, amusement, and culture | 6.74% | 154.25% | 115.06% | 149.09% |
| Education | 5.08% | 4.40% | 10.54% | 36.47% |
In more details, all sectors witnessed inflationary pressures throughout the years, following the uprising event of October 2019. Looking at the annual change in 2022, the sector most affected is health, as hospital services and medications are currently priced in fresh USD. Furthermore, due to a shortage of medications, residents are often times requesting from pharmacies to ship specific medications from overseas.
Food and non-alcoholic beverages witnessed the second largest annual inflation by 198.11% in August 2022, since imported products were also affected by the global inflation driven by the war between Ukraine and Russia. In addition, Housing water, electricity, gas and other fuels increased annually by 99.89% in August 2022, nevertheless, fuel prices alone increased substantially in the last year as the subsidy over fuel stopped in September 2021, whereas housing water and electricity prices remained almost constant over the years as they are still priced based on the official exchange rate 1507.5. However, in case the recovery plan is approved by the Lebanese parliament, the country will implement a new official exchange rate of 15,000 Lebanese pounds to USD, thereby significantly increasing electricity and water costs.
Finally, the sector least affected by inflationary pressure is education which consists of public and private schools and universities. Noting that in the last years, public establishments didn’t raise educational costs, as a result they were underfunded and subject to teachers’ strikes over devalued wages.
| Annual inflation (%) | Aug 2018-2019 | Aug 2019- 2020 | Aug 2020-2021 | Aug 2021-2022 |
| Beirut | 2.7% | 94.4% | 120.6% | 142.9% |
| Mount Lebanon | 0.8% | 115.5% | 127.5% | 149.5% |
| North Lebanon | 1.0% | 147.0% | 158.8% | 172.1% |
| Beqaa | 0.6% | 124.2% | 137.9% | 183.7% |
| South Lebanon | 2.4% | 119.4% | 156.2% | 190.0% |
| Nabatieh | 1.8% | 123.3% | 167.2% | 200.7% |
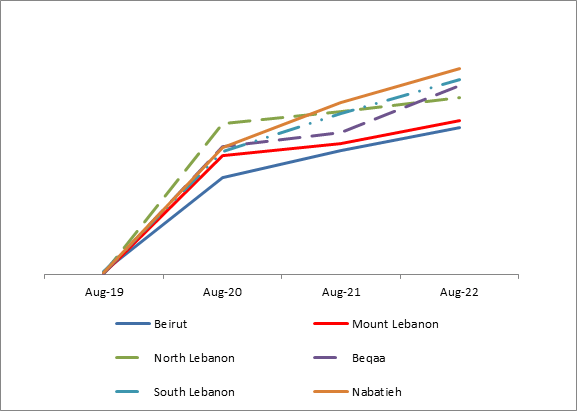
Lebanon has witnessed a hyperinflation since August 2019, mainly driven by continued depreciation of the currency on the parallel market. In fact, in August 2019, the end of period (EOP) market exchange rate was 1,600 Lebanese pounds to USD whereas, in August 2022, the EOP market exchange rate reached 33,300. In terms of regions, Nabatieh region was the most affected by inflationary pressures, followed by South Lebanon and Beqaa, due to growing transportations costs, whereas Beirut was the least affected due to its proximity to Beirut port.
In conclusion, the gradual adoption of the Sayrafa exchange rate that BDL sets daily, which currently stands at LBP 30,100/USD, led to higher inflationary pressures in 2022. In fact, the Sayrafa exchange rate was adopted for telecommunications tariffs as of July 1, 2022, thus translating into a significant increase in the phone and internet bills. Accordingly, the gradual adoption of the Sayrafa rate, along with continued depreciation of the currency on the parallel market will keep inflation in double digits in 2023. Indeed, while it is difficult to predict the exact value of the parallel market exchange rate due to lack of transparency and elevated political uncertainty, when we look at historical trend, fluctuations in the parallel market exchange rate show a meaningful correlation with political events.
Source: Central Administration of Statistics (CAS)/ Blom invest