
Discover today’s performance of BLOM indices, the closing prices of Lebanese stocks and Eurobonds, as well as the exchange rate of major currencies against the LBP.
BLOM Stock Index (BSI) – today’s performance
| Last | Previous | % Change | Y-t-D Change | |
| BSI | 1,840.58 | 1,852.78 | -0.66% | -6.71% |
| High | 1,852.78 | 1,877.17 | ||
| Low | 1,832.29 | 1,842.00 | ||
| Volume | 4,143 | 0 | ||
| Val ($) | 330,899 | 0 |
I): BLOM preferred Shares Index (BPSI): today’s Performance
| Last | Previous | Change | |
| BPSI | 39.62 | 39.62 | 0.00% |
| Volume | |||
| Value |
Lebanese Stocks: today’s Trades and Closing Prices
| Last Price ($) | % Change | Volume | VWAP ($) | |
| Solidere A | 79.85 | -1.54% | 4,050 | 79.86 |
| Solidere B | 80.1 | 0.00% | 93 | 80.1 |
Closing Date: January 09, 2024
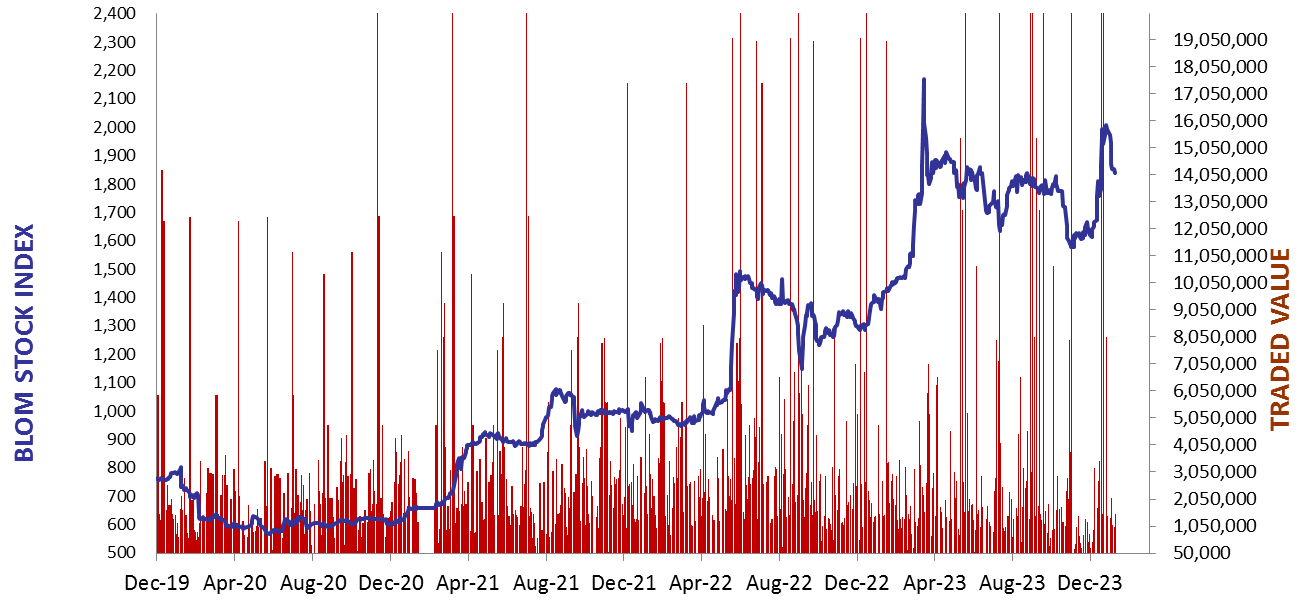
The BLOM Stock Index
BLOM BOND INDEX: Last Session’s Performance
| Last | Previous | Change | Y-t-D Change | ||
| BBI | 5.74 | 5.78 | -0.62% | -4.75% | |
| Weighted Yield | 239.55% | 236.85% | 270 | bps | |
| Duration (Years) | 1.27 | 1.29 | |||
| 5Y Bond Yield | 165.50% | 164.40% | 110 | bps | |
| 5Y Spread* | 16,068 | 15,956 | 112 | bps | |
| 10Y Bond Yield | 116.25% | 115.35% | 90 | bps | |
| 10Y Spread* | 11,214 | 11,118 | 96 | bps |
*spread between Lebanese Eurobonds and US Treasuries
| Price | Yield | Yield Change | |
| 04/11/2024 | 5.89 | 930.66% | 1,849 |
| 03/12/2024 | 5.89 | 804.47% | 1,288 |
| 26/02/2025 | 5.90 | 535.38% | 867 |
| 12/06/2025 | 6.07 | 383.75% | 420 |
| 28/11/2026 | 5.90 | 179.31% | 66 |
| 23/03/2027 | 5.88 | 165.65% | 124 |
| 29/11/2027 | 5.93 | 144.13% | 7 |
| 03/11/2028 | 5.86 | 127.28% | 59 |
| 26/02/2030 | 5.89 | 116.51% | 135 |
| 22/04/2031 | 5.94 | 116.32% | 100 |
| 23/03/2032 | 5.90 | 115.78% | 23 |
| 02/11/2035 | 5.90 | 115.87% | 94 |
| 23/03/2037 | 5.95 | 117.88% | 44 |
Closing Date: January 08, 2024
Lebanese Forex Market
| Last Price | Previous | % Change | |
| $/LBP | 15,000 | 15,000 | – |
| €/LBP | 16,408.50 | 16,425.00 | -0.10% |
| £/LBP | 19,099.50 | 19,122.00 | -0.12% |
| NEER | 242.10 | 242.06 | 0.01% |
Closing Date: January 09, 2024