
Discover today’s performance of BLOM indices, the closing prices of Lebanese stocks and Eurobonds, as well as the exchange rate of major currencies against the LBP.
BLOM Stock Index (BSI) – today’s performance
| Last | Previous | % Change | Y-t-D Change | |
| BSI | 1,831.89 | 1,720.92 | 6.45% | -7.15% |
| High | 1,898.40 | 1,729.70 | ||
| Low | 1,720.92 | 1,720.92 | ||
| Volume | 136,273 | 7,220 | ||
| Val ($) | 1,098,169 | 533,840 |
I): BLOM preferred Shares Index (BPSI): today’s Performance
| Last | Previous | Change | |
| BPSI | 39.62 | 39.62 | 0.00% |
| Volume | |||
| Value |
Lebanese Stocks: today’s Trades and Closing Prices
| Last Price ($) | % Change | Volume | VWAP ($) | |
| Solidere A | 82.25 | 11.22% | 572,200 | 77.85 |
| Solidere B | 78.75 | 6.42% | 150,589 | 78.31 |
| Blom GDR | 2.96 | -0.67% | 375,380 | 3 |
Closing Date: January 25, 2024
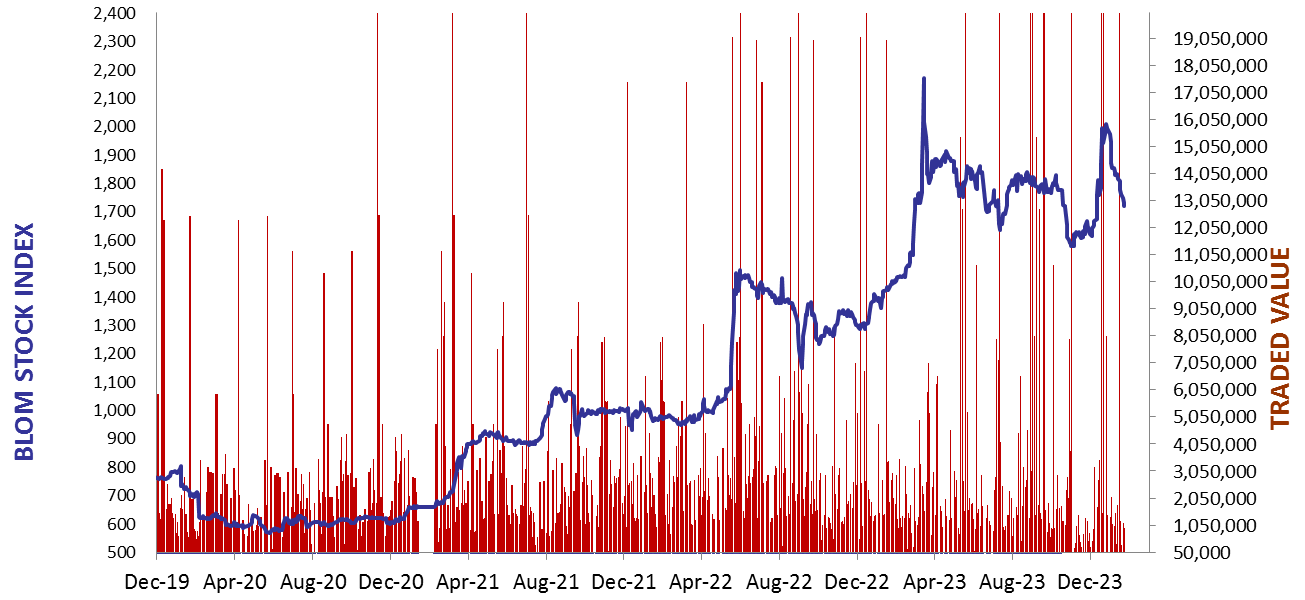
The BLOM Stock Index
BLOM BOND INDEX: Last Session’s Performance
| Last | Previous | Change | Y-t-D Change | ||
| BBI | 5.30 | 5.30 | 0.05% | -12.03% | |
| Weighted Yield | 197.06% | 196.78% | 28 | bps | |
| Duration (Years) | 1.25 | 1.25 | |||
| 5Y Bond Yield | 117.40% | 117.30% | 10 | bps | |
| 5Y Spread* | 11,257 | 11,249 | 8 | bps | |
| 10Y Bond Yield | 116.95% | 116.71% | 24 | bps | |
| 10Y Spread* | 11,276 | 11,255 | 21 | bps |
*spread between Lebanese Eurobonds and US Treasuries
| Price | Yield | Yield Change | |
| 26/02/2025 | 5.81 | 581.39% | 257 |
| 12/06/2025 | 6.06 | 397.92% | 84 |
| 28/11/2026 | 5.83 | 182.16% | (19) |
| 23/03/2027 | 5.86 | 168.17% | 6 |
| 29/11/2027 | 5.90 | 145.01% | 17 |
| 03/11/2028 | 5.80 | 128.59% | (19) |
| 26/02/2030 | 5.89 | 117.31% | 6 |
| 22/04/2031 | 5.83 | 118.33% | 44 |
| 23/03/2032 | 5.84 | 117.26% | 16 |
| 02/11/2035 | 5.84 | 116.88% | 16 |
| 23/03/2037 | 5.92 | 118.76% | (33) |
Closing Date: January 24, 2024
Lebanese Forex Market
| Last Price | Previous | % Change | |
| $/LBP | 15,000 | 15,000 | – |
| €/LBP | 16,318.50 | 16,324.50 | -0.04% |
| £/LBP | 19,083.00 | 19,084.50 | -0.01% |
| NEER | 242.63 | 242.60 | 0.01% |
Closing Date: January 25, 2024