
Discover today’s performance of BLOM indices, the closing prices of Lebanese stocks and Eurobonds, as well as the exchange rate of major currencies against the LBP.
BLOM Stock Index (BSI) – today’s performance
| Last | Previous | % Change | Y-t-D Change | |
| BSI | 1,747.68 | 1,735.77 | 0.69% | -11.42% |
| High | 1,752.56 | 1,747.90 | ||
| Low | 1,734.99 | 1,728.30 | ||
| Volume | 5,755 | 35,567 | ||
| Val ($) | 423,390 | 364,419 |
I): BLOM preferred Shares Index (BPSI): today’s Performance
| Last | Previous | Change | |
| BPSI | 39.62 | 39.62 | 0.00% |
| Volume | |||
| Value |
Lebanese Stocks: today’s Trades and Closing Prices
| Last Price ($) | % Change | Volume | VWAP ($) | |
| Solidere A | 74.5 | 1.85% | 4,378 | 73.43 |
| Solidere B | 74 | -0.27% | 1,377 | 74 |
Closing Date: April 02, 2024
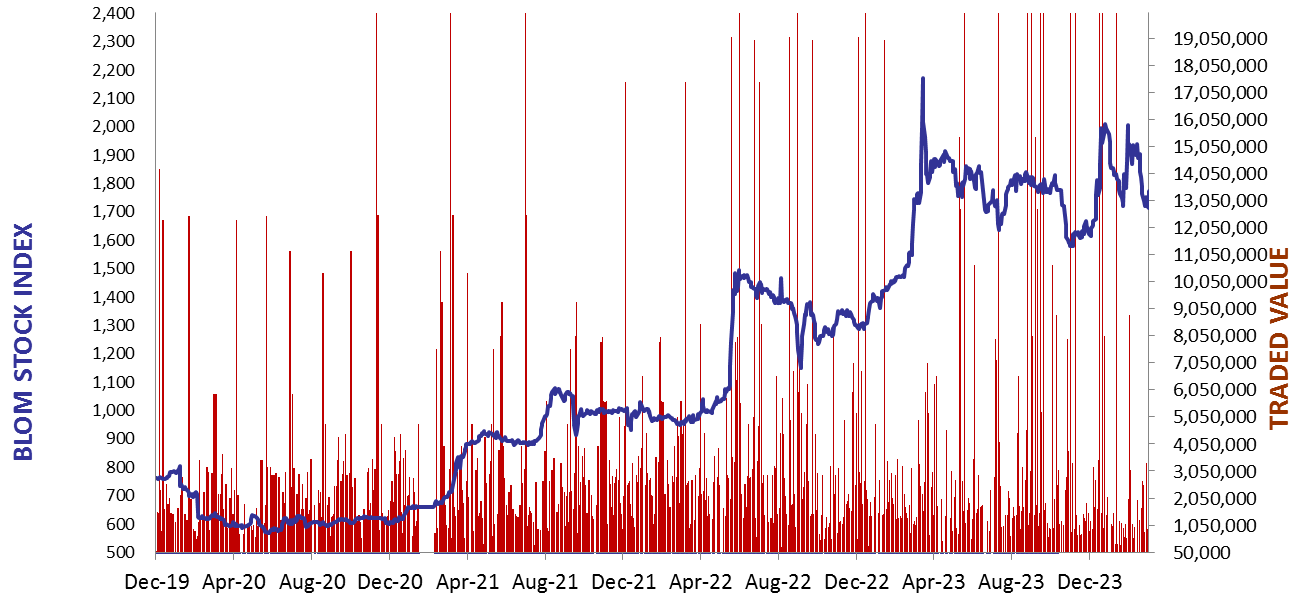
The BLOM Stock Index
BLOM BOND INDEX: Last Session’s Performance
| Last | Previous | Change | Y-t-D Change | ||
| BBI | 6.01 | 5.97 | 0.68% | -0.33% | |
| Weighted Yield | 206.61% | 207.24% | -63 | bps | |
| Duration (Years) | 1.41 | 1.40 | |||
| 5Y Bond Yield | 107.70% | 108.30% | -60 | bps | |
| 5Y Spread* | 10,267 | 10,331 | -64 | bps | |
| 10Y Bond Yield | 106.55% | 107.55% | -100 | bps | |
| 10Y Spread* | 10,215 | 10,319 | -104 | bps |
*spread between Lebanese Eurobonds and US Treasuries
| Price | Yield | Yield Change | |
| 26/02/2025 | 6.64 | 726.21% | (208) |
| 12/06/2025 | 6.78 | 446.40% | 18 |
| 28/11/2026 | 6.63 | 178.99% | (31) |
| 23/03/2027 | 6.62 | 167.21% | (34) |
| 29/11/2027 | 6.64 | 138.89% | (36) |
| 03/11/2028 | 6.64 | 120.31% | (65) |
| 26/02/2030 | 6.65 | 107.71% | (56) |
| 22/04/2031 | 6.64 | 107.46% | (59) |
| 23/03/2032 | 6.66 | 106.49% | (97) |
| 02/11/2035 | 6.65 | 104.24% | (109) |
| 23/03/2037 | 6.65 | 108.65% | (83) |
Closing Date: March 28, 2024
Lebanese Forex Market
| Last Price | Previous | % Change | |
| $/LBP | 15,000 | 15,000 | – |
| €/LBP | 16,092.00 | 16,114.50 | -0.14% |
| £/LBP | 18,814.50 | 18,825.00 | -0.06% |
| NEER | 241.78 | 241.77 | 0.00% |
Closing Date: April 02, 2024