
Discover today’s performance of BLOM indices, the closing prices of Lebanese stocks and Eurobonds, as well as the exchange rate of major currencies against the LBP.
BLOM Stock Index (BSI) – today’s performance
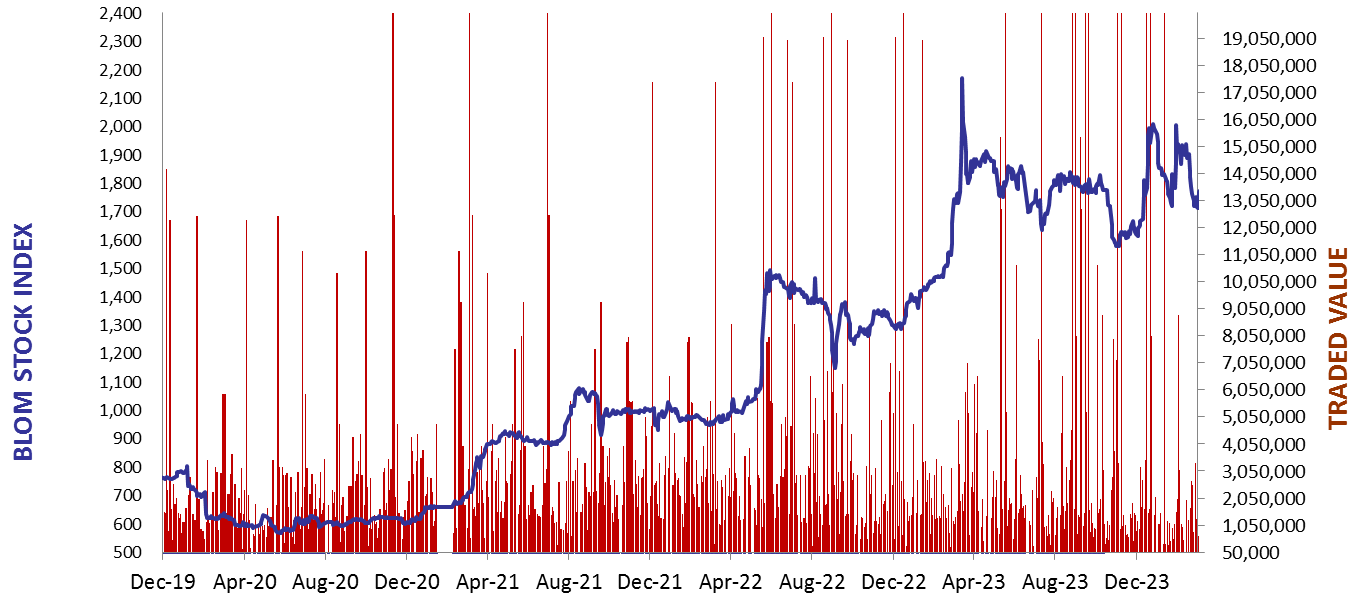
| Last | Previous | % Change | Y-t-D Change | |
| BSI | 1,701.23 | 1,692.30 | 0.53% | -13.77% |
| High | 1,753.53 | 1,744.50 | ||
| Low | 1,692.30 | 1,687.20 | ||
| Volume | 7,385 | 4,597 | ||
| Val ($) | 549,346 | 298,405 |
I): BLOM preferred Shares Index (BPSI): today’s Performance
| Last | Previous | Change | |
| BPSI | 35.15 | 35.15 | 0.00% |
| Volume | |||
| Value |
Lebanese Stocks: today’s Trades and Closing Prices
| Last Price ($) | % Change | Volume | VWAP ($) | |
| Solidere A | 74.95 | 1.15% | 4,260 | 74.98 |
| Solidere B | 73.6 | 0.14% | 3,125 | 73.58 |
Closing Date: April 16, 2024
The BLOM Stock Index
BLOM BOND INDEX: Last Session’s Performance
| Last | Previous | Change | Y-t-D Change | ||
| BBI | 5.87 | 5.99 | -1.86% | -2.59% | |
| Weighted Yield | 218.33% | 212.12% | 621 | bps | |
| Duration (Years) | 1.33 | 1.37 | |||
| 5Y Bond Yield | 109.90% | 108.25% | 165 | bps | |
| 5Y Spread* | 10,474 | 10,322 | 152 | bps | |
| 10Y Bond Yield | 108.10% | 106.60% | 150 | bps | |
| 10Y Spread* | 10,332 | 10,208 | 124 | bps |
*spread between Lebanese Eurobonds and US Treasuries
| Price | Yield | Yield Change | |
| 26/02/2025 | 6.48 | 802.85% | 3,746 |
| 12/06/2025 | 6.60 | 483.01% | 1,802 |
| 28/11/2026 | 6.42 | 186.06% | 473 |
| 23/03/2027 | 6.47 | 170.57% | 198 |
| 29/11/2027 | 6.53 | 142.03% | 185 |
| 03/11/2028 | 6.53 | 123.09% | 169 |
| 26/02/2030 | 6.48 | 109.69% | 111 |
| 22/04/2031 | 6.54 | 109.95% | 181 |
| 23/03/2032 | 6.54 | 107.49% | 111 |
| 02/11/2035 | 6.54 | 106.84% | 168 |
| 23/03/2037 | 6.55 | 109.37% | 104 |
Closing Date: April 15, 2024
Lebanese Forex Market
| Last Price | Previous | % Change | |
| $/LBP | 15,000 | 15,000 | – |
| €/LBP | 15,928.50 | 15,933.00 | -0.03% |
| £/LBP | 18,657.00 | 18,666.00 | -0.05% |
| NEER | 242.34 | 242.18 | 0.07% |
Closing Date: April 16, 2024