
Discover today’s performance of BLOM indices, the closing prices of Lebanese stocks and Eurobonds, as well as the exchange rate of major currencies against the LBP.
BLOM Stock Index (BSI) – today’s performance
| Last | Previous | % Change | Y-t-D Change | |
| BSI | 1,627.84 | 1,679.80 | -3.09% | -17.49% |
| High | 1,742.50 | 1,679.80 | ||
| Low | 1,627.60 | 1,650.76 | ||
| Volume | 5,658 | 9,471 | ||
| Val ($) | 215,654 | 285,254 |
I): BLOM preferred Shares Index (BPSI): today’s Performance
| Last | Previous | Change | |
| BPSI | 35.15 | 35.15 | 0.00% |
| Volume | |||
| Value |
Lebanese Stocks: today’s Trades and Closing Prices
| Last Price ($) | % Change | Volume | VWAP ($) | |
| Solidere A | 71.15 | -1.73% | 2,858 | 71.17 |
| BLOM – Listed Shares | 4.37 | 0.00% | 2,800 | 4.4 |
Closing Date: May 2, 2024
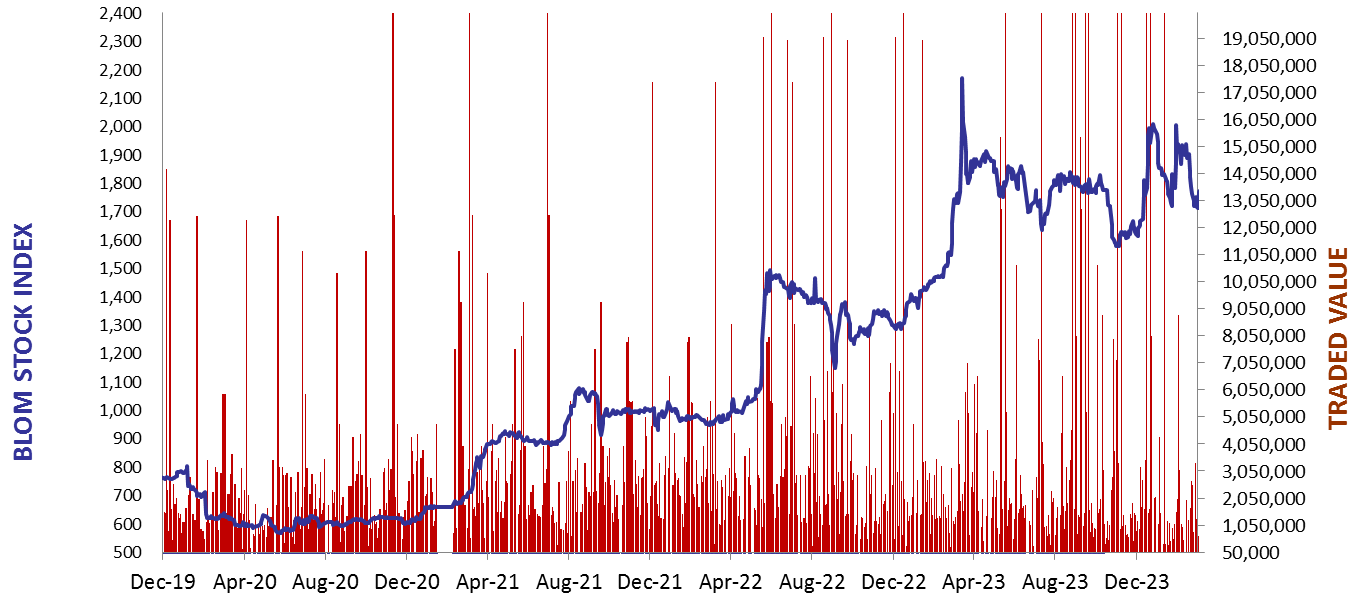
The BLOM Stock Index
BLOM BOND INDEX: Last Session’s Performance
| Last | Previous | Change | Y-t-D Change | ||
| BBI | 5.81 | 5.82 | -0.19% | -3.68% | |
| Weighted Yield | 228.91% | 228.04% | 87 | bps | |
| Duration (Years) | 1.29 | 1.29 | |||
| 5Y Bond Yield | 110.35% | 110.35% | 0 | bps | |
| 5Y Spread* | 10,510 | 10,515 | -5 | bps | |
| 10Y Bond Yield | 109.50% | 109.45% | 5 | bps | |
| 10Y Spread* | 10,463 | 10,465 | -2 | bps |
*spread between Lebanese Eurobonds and US Treasuries
| Price | Yield | Yield Change | |
| 26/02/2025 | 6.39 | 878.97% | 541 |
| 12/06/2025 | 6.58 | 514.46% | 212 |
| 28/11/2026 | 6.32 | 191.42% | 111 |
| 23/03/2027 | 6.36 | 173.43% | 13 |
| 29/11/2027 | 6.49 | 144.43% | 14 |
| 03/11/2028 | 6.41 | 126.17% | 15 |
| 26/02/2030 | 6.48 | 109.66% | 12 |
| 22/04/2031 | 6.43 | 111.73% | (0) |
| 23/03/2032 | 6.44 | 108.38% | (2) |
| 02/11/2035 | 6.43 | 109.62% | 13 |
| 23/03/2037 | 6.46 | 110.07% | 42 |
Closing Date: April 30, 2024
Lebanese Forex Market
| Last Price | Previous | % Change | |
| $/LBP | 89,500 | 89,500 | – |
| €/LBP | 95,988.75 | 95,460.70 | 0.55% |
| £/LBP | 112,179.30 | 111,803.40 | 0.34% |
| NEER | 227.47 | 227.43 | 0.02% |
Closing Date: May 2, 2024