Discover today’s performance of BLOM indices, the closing prices of Lebanese stocks and Eurobonds, as well as the exchange rate of major currencies against the LBP.
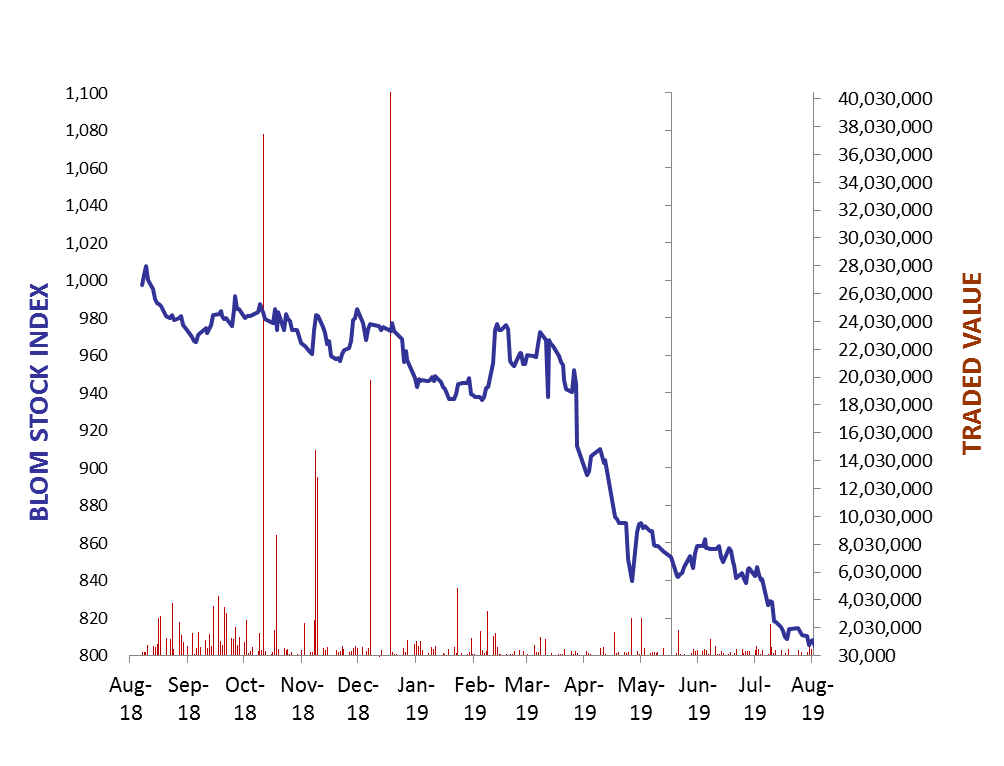
BLOM Stock Index (BSI) – today’s performance
| Last | Previous | % Change | Y-t-D Change | |
| BSI | 798.85 | 801.72 | -0.36% | -18.22% |
| High | 801.70 | 70.30 | ||
| Low | 798.80 | 801.50 | ` | |
| Volume | 575,853 | 15,977 | ||
| Val ($) | 461,223 | 436,886 |
I): BLOM preferred Shares Index (BPSI): today’s Performance
| Last | Previous | Change | |
| BPSI | 80.23 | 81.93 | -2.07% |
| Volume | 2,400 | 5,385 | |
| Value | 149,900 | 363,425 |
Lebanese Stocks: today’s Trades and Closing Prices
| Last Price ($) | % Change | Volume | VWAP ($) | |
| Solidere A | 5.9 | 1.03% | 10,185 | 5.9 |
| Solidere B | 5.81 | -0.85% | 1,000 | 5.81 |
| Bank Audi | 3.69 | -1.07% | 20,000 | 3.69 |
| Bank Audi Pref J | 69.95 | -6.73% | 2,000 | 69.95 |
| Bank of Beirut -Pref H | 25 | 0.00% | 400 | 25.00 |
| BLOM GDR | 7.09 | -0.14% | 24,268 | 7.07 |
The BLOM Stock Index
Lebanese Global Depository Receipts: Last session’s Performance
| GDRs | Last Price ($) | Previous Price ($) | % Change | Volume | Value ($) |
| BLOM GDR | 6.95 | 6.95 | 0.00% | 5,002 | 35,014 |
| Audi GDR | 3.7 | 3.7 | 0.00% | ||
| Byblos GDR | 77 | 77 | 0.00% | – | – |
Closing Date: 27 Aug. 2019
Source: London Stock Exchange
BLOM BOND INDEX: Last Session’s Performance
| Last | Previous | Change | Y-t-D Change | ||
| BBI | 77.54 | 77.90 | -0.47% | -23.28% | |
| Weighted Yield | 14.62% | 14.51% | 12 | bps | |
| Duration (Years) | 4.85 | 4.86 | |||
| 5Y Bond Yield | 16.40% | 16.28% | 12 | bps | |
| 5Y Spread* | 1,497 | 1,481 | 16 | bps | |
| 10Y Bond Yield | 13.45% | 13.32% | 13 | bps | |
| 10Y Spread* | 1201 | 1,183 | 18 | bps | |
*between Lebanese Eurobonds and US Treasuries
Closing Date: 27 Aug 2019
Lebanese Eurobonds: Last Sessions’ Prices and Yields
| Price | Yield | Yield Change | |
| 12/04/2021 | 85.08 | 19.36% | 74 |
| 04/10/2022 | 75.54 | 16.47% | 52 |
| 27/01/2023 | 73.88 | 16.26% | 42 |
| 22/04/2024 | 71.75 | 15.36% | 31 |
| 04/11/2024 | 69.92 | 14.74% | 10 |
| 03/12/2024 | 71.42 | 15.04% | 41 |
| 26/02/2025 | 69.92 | 14.28% | 19 |
| 12/06/2025 | 70.33 | 13.86% | 22 |
| 28/11/2026 | 67.92 | 13.72% | 26 |
| 23/03/2027 | 67.34 | 13.97% | 44 |
| 29/11/2027 | 67.25 | 13.43% | 24 |
| 03/11/2028 | 67.33 | 12.79% | 22 |
| 26/02/2030 | 66.58 | 12.44% | 20 |
| 22/04/2031 | 66.35 | 12.57% | 18 |
| 23/03/2032 | 66.92 | 12.21% | 20 |
| 02/11/2035 | 66.83 | 11.65% | 18 |
| 23/03/2037 | 66.75 | 11.77% | 20 |
Lebanese Forex Market
| Last Price | Previous | % Change | Y-t-D | |
| $/LBP | 1,514.25 | 1,514.25 | – | |
| €/LBP | 1,670.91 | 1,671.82 | -0.05% | |
| £/LBP | 1,839.15 | 1,852.27 | -0.71% | |
| NEER | 120.20 | 120.11 | 0.07% |
Closing Date: 28 Aug. 2019