Discover today’s performance of BLOM indices, the closing prices of Lebanese stocks and Eurobonds, as well as the exchange rate of major currencies against the LBP.
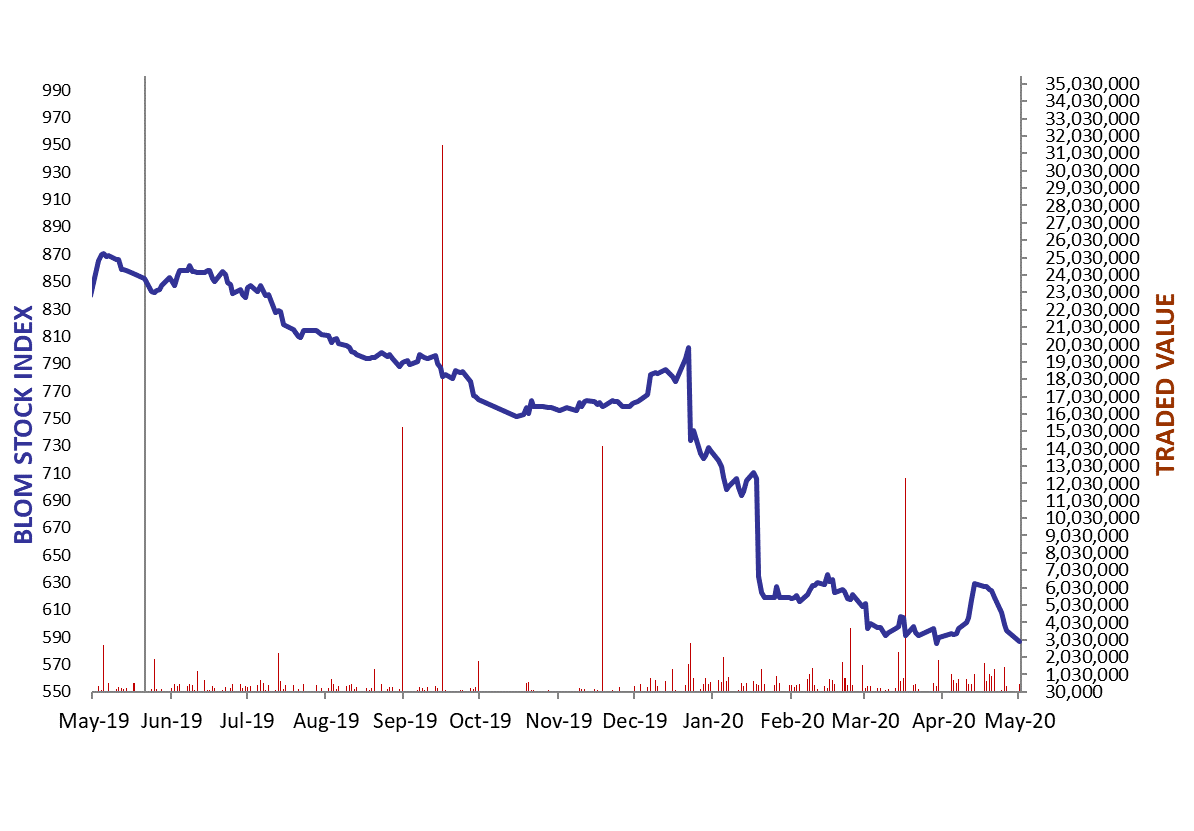
BLOM Stock Index (BSI) – today’s performance
| Last | Previous 13.05.2020 | % Change | Y-t-D Change | |
| BSI | 573.21 | 581.33 | -1.40% | -27.03% |
| High | 589.23 | 586.98 | ||
| Low | 572.20 | 581.00 | ||
| Volume | 4,055,427 | 132,519 | ||
| Val ($) | 12,486,550 | 1,251,345 |
I): BLOM preferred Shares Index (BPSI): today’s Performance
| Last | Previous | Change | |
| BPSI | 66.46 | 66.46 | 0.00% |
| Volume | – | – | |
| Value | – | – |
Lebanese Stocks: today’s Trades and Closing Prices
| Last Price ($) | % Change | Volume | VWAP ($) | |
| Solidere A | 9.96 | 7.44% | 40,639 | 9.7 |
| Solidere B | 9.63 | -2.43% | 12,182 | 9.6 |
| Bank Audi listed | 1.07 | -10.83% | 17,000 | 1.1 |
| Blom Bank Listed | 3.00 | -8.54% | 3,984,606 | 3 |
| CB (N) | 3.20 | 0.63% | 1,000 | 3.2 |
Closing Date: May 20, 2020
The BLOM Stock Index
Lebanese Global Depository Receipts: Last Session’s Performance
| Global Depository Receipts (GDRs) | Last Price ($) | Previous Price ($) | % Change | Volume | Value ($) |
| BLOM GDR | 1.505 | 1.505 | 0.00% | 1,040 | 1,565 |
| Audi GDR | 0.43 | 0.51 | -15.69% | 6,664 | 3,337 |
| Byblos GDR | 70 | 70 | 0.00% | – | – |
Closing Date: May 18, 2020
Source: London Stock Exchange
BLOM BOND INDEX: Last Session’s Performance
| Last | Previous | Change | Y-t-D Change | ||
| BBI | 16.67 | 16.93 | -1.49% | -67.02% | |
| Weighted Yield | 60.12% | 59.43% | 69 | bps | |
| Duration (Years) | 2.84 | 2.87 | |||
| 5Y Bond Yield | 102.40% | 102.00% | 40 | bps | |
| 5Y Spread* | 10,223 | 10,182 | 41 | bps | |
| 10Y Bond Yield | 48.00% | 47.40% | 60 | bps | |
| 10Y Spread* | 4,765 | 4,702 | 63 | bps | |
*spread between Lebanese Eurobonds and US Treasuries
Closing Date: May 19th 2020
Lebanese Eurobonds: Last Sessions’ Prices and Yields
| Price | Yield | Yield Change | |
| 04/10/2022 | 17.50 | 108.78% | 119 |
| 27/01/2023 | 17.58 | 95.76% | 102 |
| 22/04/2024 | 17.50 | 71.52% | 73 |
| 04/11/2024 | 17.58 | 63.48% | 157 |
| 03/12/2024 | 17.58 | 65.48% | 67 |
| 26/02/2025 | 17.50 | 60.25% | 61 |
| 12/06/2025 | 18.58 | 55.70% | 93 |
| 28/11/2026 | 17.68 | 50.49% | 32 |
| 23/03/2027 | 17.50 | 50.43% | 53 |
| 29/11/2027 | 17.58 | 47.70% | 50 |
| 03/11/2028 | 17.42 | 45.27% | 80 |
| 26/02/2030 | 17.63 | 42.33% | 24 |
| 22/04/2031 | 17.08 | 43.87% | 154 |
| 23/03/2032 | 17.58 | 41.89% | 51 |
| 02/11/2035 | 17.50 | 40.91% | 54 |
| 23/03/2037 | 17.50 | 41.65% | 56 |
Lebanese Forex Market
| Last Price | Previous 13.05.2020 | % Change | Y-t-D | |
| $/LBP | 1,514.25 | 1,514.25 | – | |
| €/LBP | 1,650.86 | 1,628.40 | 1.38% | |
| £/LBP | 1,846.54 | 1,861.01 | -0.78% | |
| NEER | 123.21 | 123.26 | -0.04% |
Closing Date: May 20, 2020