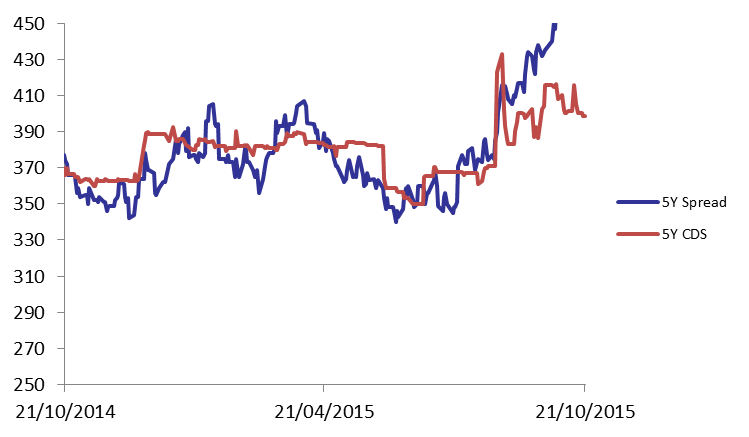
Demand for Lebanese Eurobonds weakened on Wednesday following three positive sessions, which caused the BLOM Bond Index (BBI) to decline by 0.13% to 105.04 points, broadening its year-to-date loss to 2.26%. Yields on the 5Y and 10Y Lebanese Eurobonds went up by 5 basis points (bps) and 3 bps to 5.96% and 6.45%, respectively. In the US, demand for medium term maturities stagnated, causing the 5Y spread between the Lebanese Eurobonds and their U.S counterpart to broaden by 5 bps to 456 bps. As for the Lebanese 5Y Credit Default Swaps (CDS), they remained at their previous quotes of 387-410 bps.
| Last | Previous | Change | Y-t-D Change | ||
| BBI | 105.040 | 105.181 | -0.134% | -2.26% | |
| Weighted Yield | 5.90% | 5.86% | 4 | bps | |
| Duration (Years) | 4.92 | 4.93 | |||
| 5Y Bond Yield | 5.96% | 5.91% | 5 | bps | |
| 5Y Spread* | 456 | 451 | 5 | bps | |
| 10Y Bond Yield | 6.45% | 6.42% | 3 | bps | |
| 10Y Spread* | 437 | 434 | 3 | bps | |
*Between Lebanese and U.S notes
| Price | Yield | Yield Change (in bps) | |
| Nov. 2016 | 100.4 | 4.35% | 0 |
| Mar. 2017 | 105.5 | 4.92% | 17 |
| Oct. 2017 | 99.75 | 5.13% | 13 |
| Jun. 2018 | 99.75 | 5.25% | 10 |
| Nov. 2018 | 99.5 | 5.33% | 9 |
| Apr. 2019 | 100 | 5.50% | 0 |
| May. 2019 | 101.25 | 5.61% | 8 |
| Nov.2019 | 99 | 5.73% | 4 |
| Mar. 2020 | 102.13 | 5.82% | 3 |
| Apr. 2020 | 99.75 | 5.86% | 6 |
| Apr. 2021 | 110.25 | 6.02% | 3 |
| Oct. 2022 | 99.75 | 6.14% | 2 |
| Jan. 2023 | 99 | 6.17% | 0 |
| Dec. 2024 | 104.5 | 6.34% | 2 |
| Feb. 2025 | 98.88 | 6.36% | 0 |
| Jun. 2025 | 98.88 | 6.41% | 2 |
| Nov. 2026 | 100.5 | 6.53% | 2 |
| Nov. 2027 | 101.13 | 6.61% | 1 |
| Feb. 2030 | 99.25 | 6.73% | 0 |