
Discover today’s performance of BLOM indices, the closing prices of Lebanese stocks and Eurobonds, as well as the exchange rate of major currencies against the LBP.
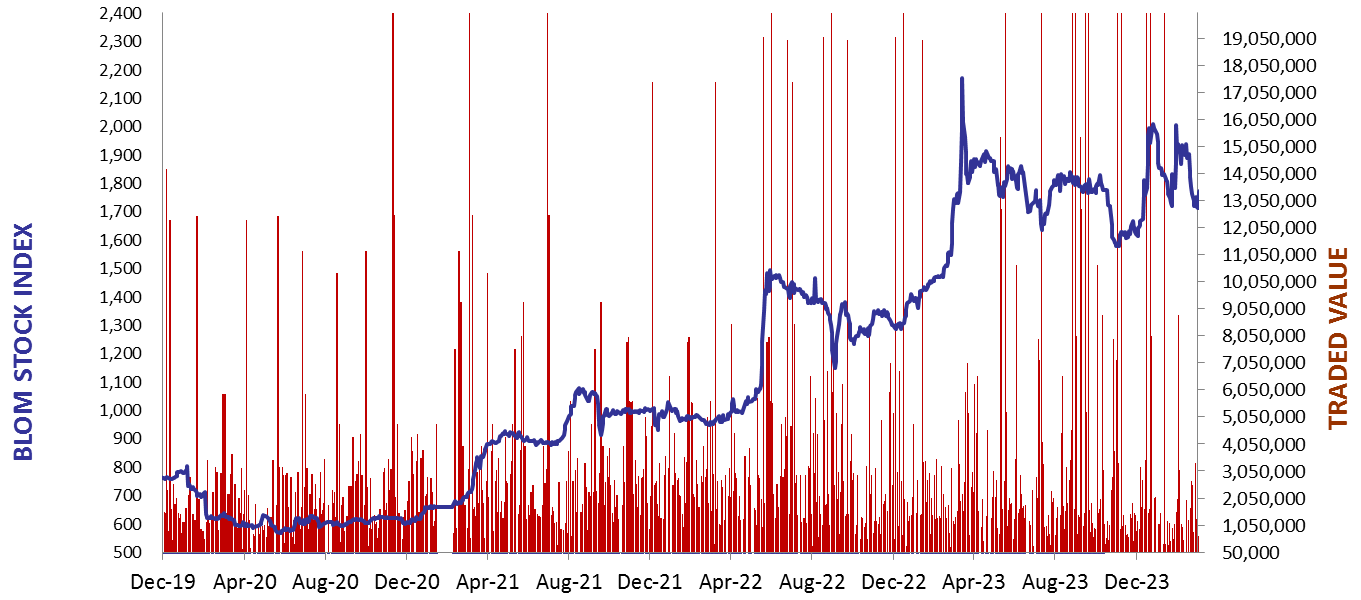
BLOM Stock Index (BSI) – today’s performance
| Last | Previous | % Change | Y-t-D Change | |
| BSI | 1,635.38 | 1,631.67 | 0.23% | -17.11% |
| High | 1,635.38 | 1,684.96 | ||
| Low | 1,631.67 | 1,631.67 | ||
| Volume | 14,860 | 29,226 | ||
| Val ($) | 1,032,147 | 2,044,707 |
I): BLOM preferred Shares Index (BPSI): today’s Performance
| Last | Previous | Change | |
| BPSI | 35.15 | 35.15 | 0.00% |
| Volume | |||
| Value |
Lebanese Stocks: today’s Trades and Closing Prices
| Last Price ($) | % Change | Volume | VWAP ($) | |
| Solidere A | 73.1 | 5.48% | 11,815 | 71.92 |
| Solidere B | 66.55 | -7.25% | 45 | 66.55 |
| HOLCIM | 59.8 | -0.33% | 3,000 | 59.8 |
Closing Date: April 25, 2024
The BLOM Stock Index
BLOM BOND INDEX: Last Session’s Performance
| Last | Previous | Change | Y-t-D Change | ||
| BBI | 5.79 | 5.79 | 0.01% | -3.97% | |
| Weighted Yield | 225.47% | 224.90% | 56 | bps | |
| Duration (Years) | 1.31 | 1.31 | |||
| 5Y Bond Yield | 111.00% | 111.00% | 0 | bps | |
| 5Y Spread* | 10,583 | 10,586 | -3 | bps | |
| 10Y Bond Yield | 109.95% | 110.00% | -5 | bps | |
| 10Y Spread* | 10,517 | 10,524 | -7 | bps |
*spread between Lebanese Eurobonds and US Treasuries
| Price | Yield | Yield Change | |
| 26/02/2025 | 6.40 | 849.64% | 456 |
| 12/06/2025 | 6.56 | 502.60% | 179 |
| 28/11/2026 | 6.29 | 190.34% | 39 |
| 23/03/2027 | 6.36 | 172.92% | (10) |
| 29/11/2027 | 6.44 | 144.35% | 4 |
| 03/11/2028 | 6.41 | 125.53% | 6 |
| 26/02/2030 | 6.44 | 110.22% | 25 |
| 22/04/2031 | 6.43 | 112.02% | (61) |
| 23/03/2032 | 6.42 | 108.90% | (7) |
| 02/11/2035 | 6.43 | 109.17% | (5) |
| 23/03/2037 | 6.46 | 110.34% | (11) |
Closing Date: April 24, 2024
Lebanese Forex Market
| Last Price | Previous | % Change | |
| $/LBP | 15,000 | 15,000 | – |
| €/LBP | 16,068.00 | 16,045.50 | 0.14% |
| £/LBP | 18,709.50 | 18,691.50 | 0.10% |
| NEER | 242.50 | 242.50 | – |
Closing Date: April 25, 2024