Lebanon’s trade deficit stood at $2.79B by February 2017, widening from the $2.46B registered by the same period last year. Total imports grew by 13.27% year-on-year (y-o-y) to $3.25B, while exports rose only by 10.57% y-o-y to $457.72M.
The top imported goods to Lebanon were Mineral Products with a share of 28.07%, followed by 9.94% for products of the Chemical and Allied Industries and 8.64% for Machinery and Electrical Instruments.
The value of imported Mineral Products rose from $691.56M to $913.07M by February 2017. The value of products of Machinery and Electrical Instruments increased from $258.45M to $280.92M. Also, the value of products of the Chemical and Allied Industries rose from $303.02M to reach $323.44M by February 2017.
As for exports, the top exported products from Lebanon were Pearls, Precious stones and metals with a stake of 23.96% of the total, followed by Prepared foodstuffs, beverages and tobacco grasping a share of 15.51% of total exports, and Base metals and articles of base metal with a share of 11.16% of the total.
In details, the value of Pearls, precious stones &metals rose from $70M to $109.69M by Feb.2017, while Prepared foodstuffs, beverages and tobacco rose from $67.61M to stand at $70.98M in the same period. The value of base metals and articles of base metal also increased from $39.88M to $51.08M by Feb.2017.
In the second month of the year, the deficit rose by 23.79% y-o-y, to stand at $1.42B in Feb.2017. Lebanon’s top three import destinations in the same period were Kuwait, China, and Russia with shares of 10.44%, 8.82%, and 8.18%, respectively.
The top three export destinations in February 2017 were: Syria with 13.11%, followed by South Africa with 8.68%, and the KSA with 8.18%.
Trade Deficit by February ($B)
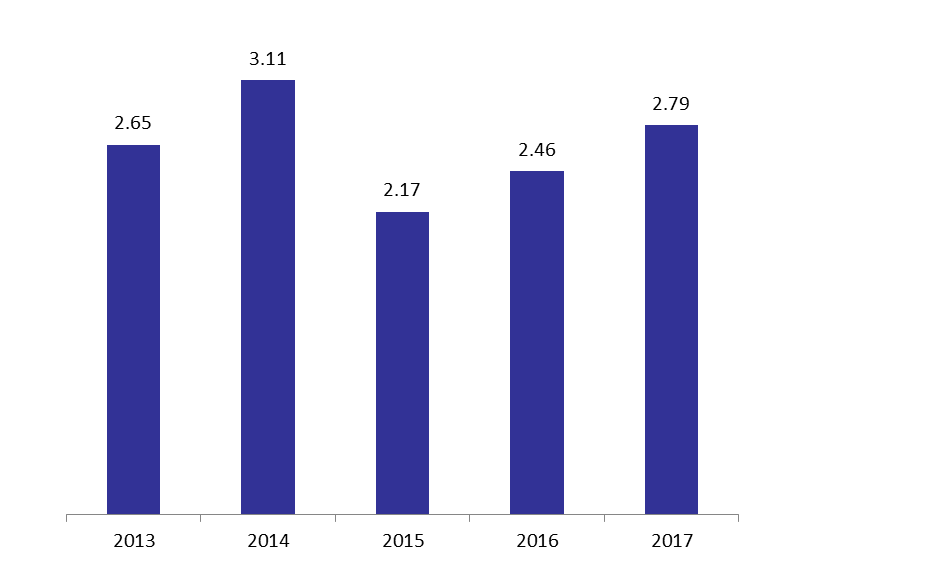
Source: Lebanese Customs