
Discover today’s performance of BLOM indices, the closing prices of Lebanese stocks and Eurobonds, as well as the exchange rate of major currencies against the LBP.
BLOM Stock Index (BSI): Today’s Performance
| Last | Previous | % Change | Y-t-D Change | |
| BSI | 1,162.34 | 1,164.05 | -0.15% | -4.16% |
| High | 1,165.23 | 1,164.78 | ||
| Low | 1,162.34 | 1,162.09 | ||
| Volume | 197,579 | 82,721 | 138.85% | |
| Val ($) | 3,036,174 | 1,917,969 | 58.30% |
BLOM Preferred Shares Index (BPSI): Today’s Performance
| Last | Previous | Change | |
| BPSI | 104.62 | 104.67 | -0.05% |
| Volume | 10,277 | 12,868 | |
| Value | 1,030,680 | 1,146,942 |
Lebanese Stocks: Today’s Trades and Closing Prices
| Last Price ($) | % Change | Volume | VWAP ($) | |
| Solidere A | 8.43 | -0.82% | 15,309 | 8.57 |
| Solidere B | 8.51 | -2.18% | 240 | 8.51 |
| Bank Audi Pref G | 100.20 | 0.00% | 9,250 | 100.20 |
| Byblos Bank Listed | 1.62 | 0.00% | 13,000 | 1.62 |
| Byblos Bank Pref 2009 | 101.10 | -0.39% | 1,027 | 101.10 |
| Blom Listed | 11.10 | 0.00% | 65,000 | 11.10 |
| Blom GDR | 12.05 | -0.17% | 93,692 | 12.05 |
| Holcim | 12.37 | 3.08% | 61 | 12.37 |
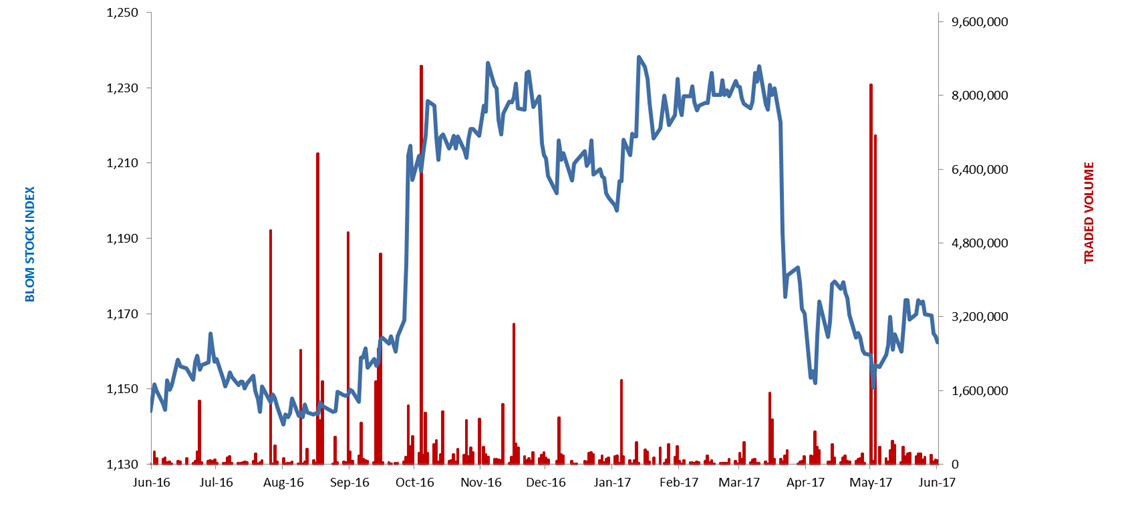
The BLOM Stock Index
Lebanese Global Depository Receipts: Last session’s Performance
| GDRs | Last Price ($) | Previous Price ($) | % Change | Volume | Value ($) |
| BLOM GDR | 11.9 | 11.9 | 0.0% | – | – |
| Audi GDR | 6 | 6.0 | 0.0% | 142,387 | 854,390 |
| Byblos GDR | 80 | 80 | 0.0% | – | – |
| Solidere GDR | 8.68 | 8.67 | 0.1% | 5,961 | 50,077 |
Source: Reuters
Closing Date: 21 June 2017
BLOM BOND INDEX: Last Session’s Performance
| Last | Previous | Change | Y-t-D Change | ||
| BBI | 105.55 | 105.94 | -0.37% | 3.58% | |
| Weighted Yield | 5.975% | 5.905% | 6.99 | bps | |
| Duration (Years) | 5.29 | 5.30 | |||
| 5Y Bond Yield | 5.80% | 5.74% | 6 | bps | |
| 5Y Spread* | 402 | 397 | 5 | bps | |
| 10Y Bond Yield | 6.64% | 6.57% | 7 | bps | |
| 10Y Spread* | 448 | 441 | 7 | bps | |
*between Lebanese Eurobonds and US Treasuries
Closing Date: 21 June 2017
Lebanese Eurobonds: Last Sessions’ Prices and Yields
| Price | Yield | Yield Change | |
| 12/06/2018 | 100.75 | 4.35% | 0 |
| 12/11/2018 | 101.00 | 4.40% | 0 |
| 23/04/2019 | 101.00 | 4.92% | 7 |
| 20/05/2019 | 101.75 | 5.03% | 14 |
| 28/11/2019 | 100.75 | 5.12% | 11 |
| 09/03/2020 | 102.65 | 5.31% | 0 |
| 14/04/2020 | 100.88 | 5.45% | 10 |
| 19/06/2020 | 101.75 | 5.51% | 11 |
| 12/04/2021 | 108.88 | 5.62% | 10 |
| 04/10/2022 | 101.13 | 5.85% | 6 |
| 27/01/2023 | 100.38 | 5.92% | 3 |
| 22/04/2024 | 102.00 | 6.28% | 7 |
| 04/11/2024 | 99.63 | 6.31% | 9 |
| 03/12/2024 | 104.00 | 6.32% | 8 |
| 26/02/2025 | 99.13 | 6.34% | 8 |
| 12/06/2025 | 99.25 | 6.37% | 8 |
| 28/11/2026 | 100.63 | 6.51% | 12 |
| 23/03/2027 | 101.63 | 6.62% | 7 |
| 29/11/2027 | 100.63 | 6.66% | 7 |
| 03/11/2028 | 99.25 | 6.74% | 6 |
| 26/02/2030 | 99.00 | 6.77% | 6 |
| 22/04/2031 | 101.00 | 6.89% | 7 |
| 23/03/2032 | 100.88 | 6.90% | 8 |
| 02/11/2035 | 100.25 | 7.02% | 2 |
| 23/03/2037 | 101.13 | 7.14% | 6 |
| Last Price | Previous | % Change | Y-t-D | |
| $/LBP | 1,514.00 | 1,514.00 | – | |
| €/LBP | 1,683.43 | 1,683.58 | -0.01% | |
| £/LBP | 1,908.80 | 1,910.30 | -0.08% | |
| NEER | 114.74 | 114.82 | -0.07% | -3.10% |
Closing Date: 22 June 2017