
Discover today’s performance of BLOM indices, the closing prices of Lebanese stocks and Eurobonds, as well as the exchange rate of major currencies against the LBP.
BLOM Stock Index (BSI): Today’s Performance
| Last | Previous | % Change | Y-t-D Change | |
| BSI | 1,154.49 | 1,158.70 | -0.36% | -4.80% |
| High | 1,156.55 | 1,159.40 | ||
| Low | 1,154.21 | 1,154.25 | ||
| Volume | 215,188 | 20,434 | 953.09% | |
| Val ($) | 2,470,804 | 303,946 | 712.91% |
BLOM Preferred Shares Index (BPSI): Today’s Performance
| Last | Previous | Change | |
| BPSI | 105.12 | 105.12 | 0.00% |
| Volume | – | 2,000 | |
| Value | – | 204,000 |
Lebanese Stocks: Today’s Trades and Closing Prices
| Last Price ($) | % Change | Volume | VWAP ($) | |
| Solidere A | 8.16 | -0.24% | 7,975 | 8.16 |
| Solidere B | 7.88 | -1.50% | 1,425 | 7.88 |
| Bank Audi | 5.95 | -0.34% | 700 | 5.95 |
| BLOM Bank Listed | 11.5 | 0.00% | 174,000 | 11.5 |
| BLOM Bank GDR | 12.55 | 0.00% | 11,088 | 12.55 |
| HOLCIM | 12.51 | -7.33% | 20,000 | 12.51 |
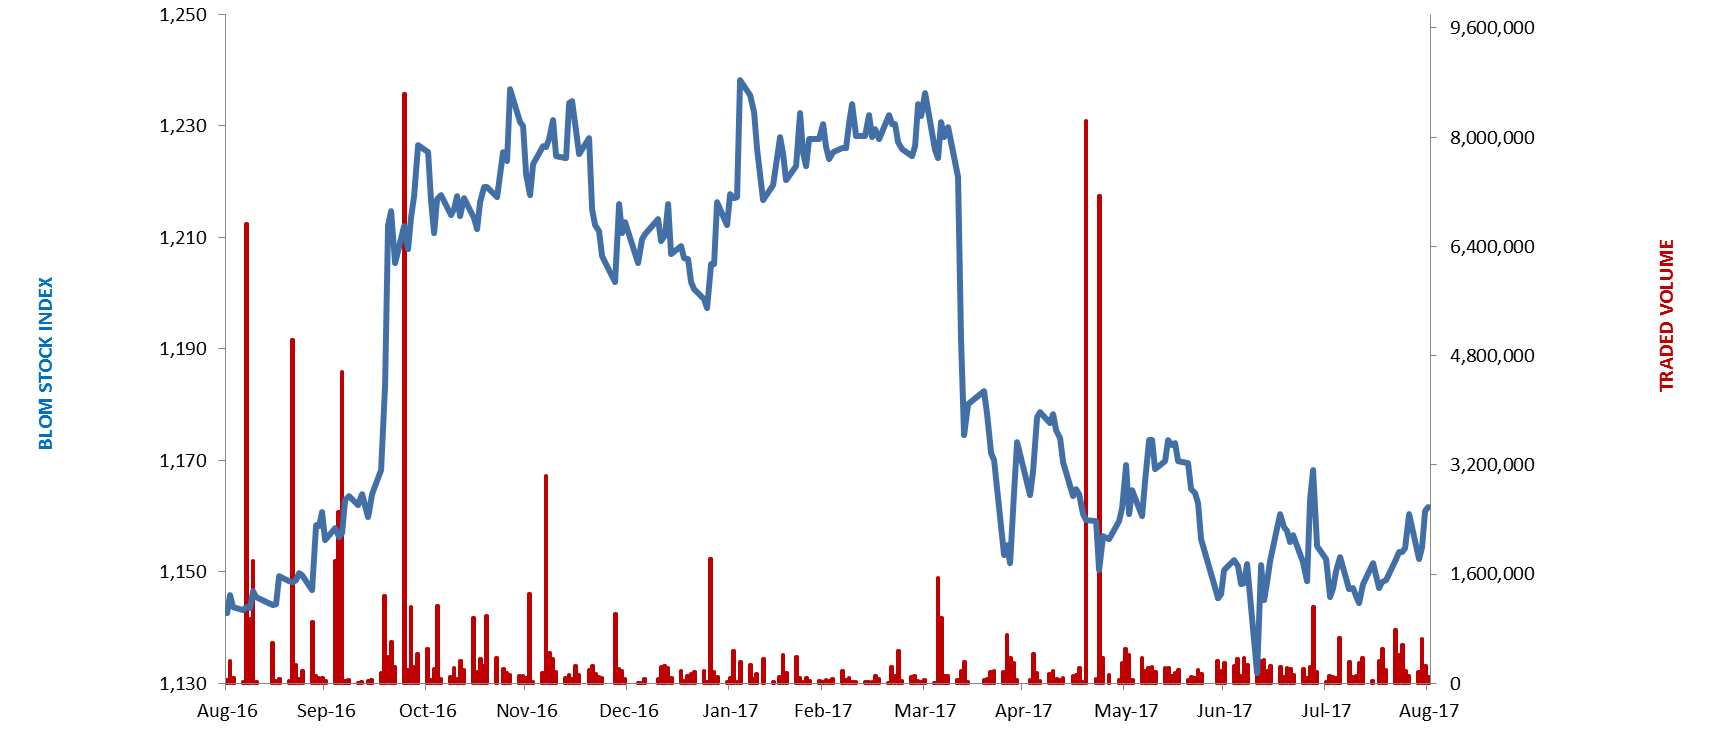
The BLOM Stock Index
Lebanese Global Depository Receipts: Last session’s Performance
| GDRs | Last Price ($) | Previous Price ($) | % Change | Volume | Value ($) |
| BLOM GDR | 12.5 | 12.6 | -0.8% | 4,948 | 61,604 |
| Audi GDR | 5.91 | 5.95 | -0.7% | – | – |
| Byblos GDR | 80 | 80 | 0.0% | – | – |
Source: London Stock Exchange
Closing Date: 5 Sept 2017
BLOM BOND INDEX: Last Session’s Performance
| Last | Previous | Change | Y-t-D Change | ||
| BBI | 104.16 | 103.59 | 0.56% | 2.22% | |
| Weighted Yield | 6.272% | 6.397% | -13 | bps | |
| Duration (Years) | 5.23 | 5.23 | |||
| 5Y Bond Yield | 6.26% | 6.43% | -17 | bps | |
| 5Y Spread* | 461 | 473 | -12 | bps | |
| 10Y Bond Yield | 6.82% | 6.92% | -10 | bps | |
| 10Y Spread* | 475 | 480 | -5 | bps | |
*between Lebanese Eurobonds and US Treasuries
Closing Date: 05 September 2017
Lebanese Eurobonds: Last Sessions’ Prices and Yields
| Price | Yield | Yield Change | |
| 12/11/2018 | 100.50 | 4.71% | 0 |
| 23/04/2019 | 100.60 | 5.11% | -14 |
| 20/05/2019 | 101.38 | 5.14% | -16 |
| 28/11/2019 | 100.63 | 5.14% | -18 |
| 09/03/2020 | 101.88 | 5.56% | -22 |
| 14/04/2020 | 100.38 | 5.64% | -21 |
| 19/06/2020 | 100.88 | 5.80% | -10 |
| 12/04/2021 | 107.25 | 5.98% | -23 |
| 04/10/2022 | 99.25 | 6.27% | -18 |
| 27/01/2023 | 98.50 | 6.33% | -17 |
| 22/04/2024 | 100.38 | 6.58% | -9 |
| 04/11/2024 | 98.13 | 6.58% | -11 |
| 03/12/2024 | 102.13 | 6.62% | -7 |
| 26/02/2025 | 97.50 | 6.63% | -6 |
| 12/06/2025 | 97.63 | 6.64% | -6 |
| 28/11/2026 | 99.25 | 6.71% | -9 |
| 23/03/2027 | 100.38 | 6.79% | -11 |
| 29/11/2027 | 99.38 | 6.83% | -9 |
| 03/11/2028 | 98.00 | 6.91% | -13 |
| 26/02/2030 | 97.38 | 6.97% | -11 |
| 22/04/2031 | 99.50 | 7.06% | -4 |
| 23/03/2032 | 99.00 | 7.11% | -4 |
| 02/11/2035 | 97.50 | 7.30% | -5 |
| 23/03/2037 | 99.13 | 7.33% | -6 |
| Last Price | Previous | % Change | Y-t-D | |
| $/LBP | 1,514.00 | 1,514.00 | – | |
| €/LBP | 1,797.84 | 1,795.73 | 0.12% | |
| £/LBP | 1,965.93 | 1,809.00 | 8.68% | |
| NEER | 110.60 | 111.21 | -0.55% | -6.59% |
Closing Date: 6 September 2017