
Discover today’s performance of BLOM indices, the closing prices of Lebanese stocks and Eurobonds, as well as the exchange rate of major currencies against the LBP.
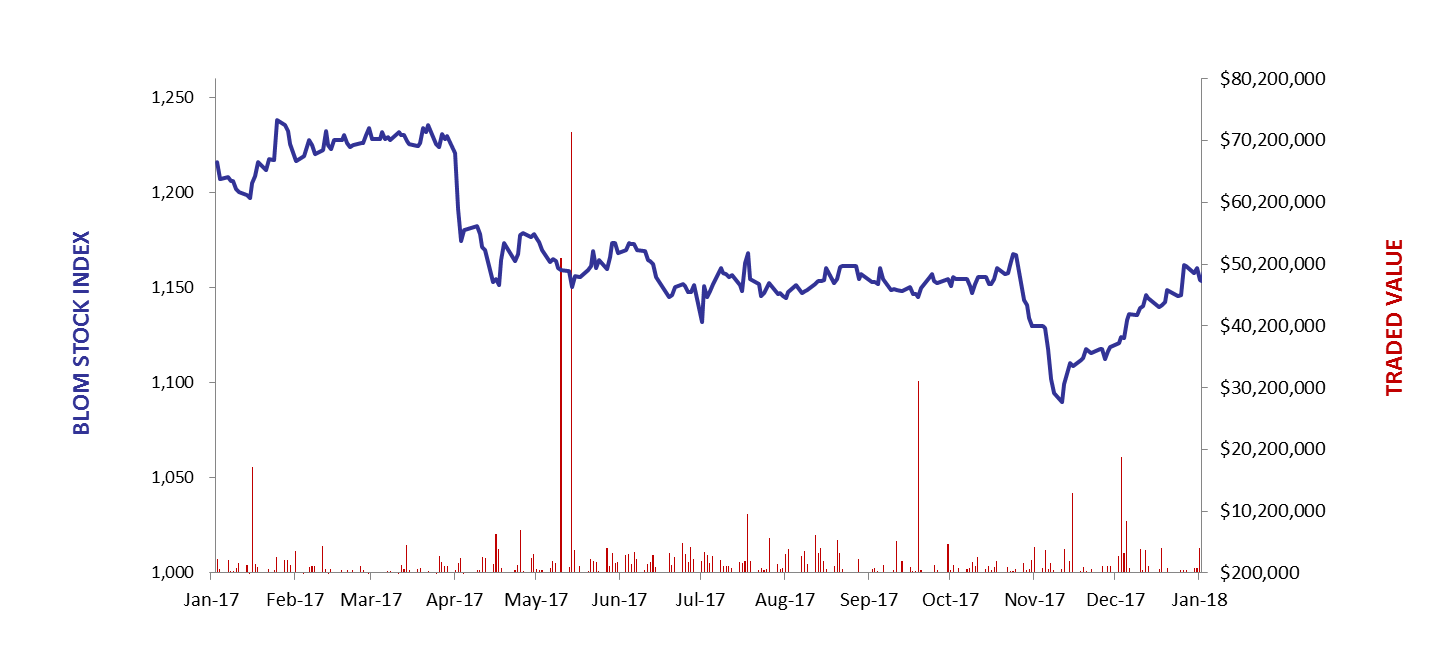
BLOM Stock Index (BSI): Today’s Performance
| Last | Previous | % Change | Y-t-D Change | |
| BSI | 1,170.16 | 1,171.09 | -0.08% | -3.51% |
| High | 1,171.09 | 1,171.76 | ||
| Low | 1,168.21 | 1,160.61 | ||
| Volume | 193,444 | 45,249 | 327.51% | |
| Val ($) | 1,569,429 | 572,089 | 174.33% |
BLOM preferred Shares Index (BPSI): Today’s Performance
| Last | Previous | Change | |
| BPSI | 107.25 | 107.70 | -0.42% |
| Volume | 1,250 | 500 | |
| Value | 36,240 | 51,150 |
Lebanese Stocks: Today’s Trades and Closing Prices
| Last Price ($) | % Change | Volume | VWAP ($) | |
| Solidere A | 8.01 | 0.12% | 189,254 | 7.93 |
| Solidere B | 7.81 | -2.25% | 1,740 | 7.81 |
| Bank of Beirut Pref H | 25.9 | 0.00% | 1,200 | 25.9 |
| Byblos Bank Pref 2009 | 103.2 | -1.62% | 50 | 103.2 |
| BLOM GDR | 12.85 | 0.23% | 200 | 12.85 |
| HOLCIM | 15.49 | 0.91% | 1,000 | 15.49 |
The BLOM Stock Index
Lebanese Global Depository Receipts: Last session’s Performance
| GDRs | Last Price ($) | Previous Price ($) | % Change | Volume | Value ($) |
| BLOM GDR | 13 | 12.8 | 1.6% | 2,895 | 37,635 |
| Audi GDR | 5.9 | 5.8 | 1.7% | 17,000 | 100,300 |
| Byblos GDR | 76 | 76 | 0.0% | – | – |
Source: London Stock Exchange
Closing Date: 15 January 2018
BLOM BOND INDEX: Last Session’s Performance
| Last | Previous | Change | Y-t-D Change | ||
| BBI | 103.03 | 102.87 | 0.16% | 1.11% | |
| Weighted Yield | 6.45% | 6.49% | -4 | bps | |
| Duration (Years) | 1.89 | 4.99 | |||
| 5Y Bond Yield | 6.10% | 6.20% | -10 | bps | |
| 5Y Spread* | 375 | 385 | -10 | bps | |
| 10Y Bond Yield | 6.96% | 7.00% | -4 | bps | |
| 10Y Spread* | 441 | 445 | -4 | bps | |
*between Lebanese Eurobonds and US Treasuries
Closing Date: 15 January 2018
Lebanese Eurobonds: Last Sessions’ Prices and Yields
| Price | Yield | Yield Change | |
| 12/11/2018 | 100.00 | 5.14% | 0 |
| 23/04/2019 | 100.25 | 5.29% | 0 |
| 20/05/2019 | 100.88 | 5.31% | 0 |
| 28/11/2019 | 100.13 | 5.37% | -7 |
| 09/03/2020 | 101.63 | 5.56% | 0 |
| 14/04/2020 | 100.13 | 5.73% | 0 |
| 19/06/2020 | 100.63 | 5.87% | -6 |
| 12/04/2021 | 106.50 | 6.01% | -9 |
| 04/10/2022 | 99.25 | 6.28% | -6 |
| 27/01/2023 | 98.13 | 6.44% | -6 |
| 22/04/2024 | 99.63 | 6.72% | -5 |
| 04/11/2024 | 97.25 | 6.76% | -5 |
| 03/12/2024 | 101.13 | 6.79% | -2 |
| 26/02/2025 | 96.50 | 6.83% | -5 |
| 12/06/2025 | 96.38 | 6.88% | -2 |
| 28/11/2026 | 97.88 | 6.92% | -4 |
| 23/03/2027 | 99.00 | 7.00% | -6 |
| 29/11/2027 | 98.25 | 7.00% | -9 |
| 03/11/2028 | 96.13 | 7.17% | 2 |
| 26/02/2030 | 94.75 | 7.31% | -2 |
| 22/04/2031 | 96.63 | 7.40% | 0 |
| 23/03/2032 | 96.13 | 7.44% | 0 |
| 02/11/2035 | 95.75 | 7.48% | 0 |
| 23/03/2037 | 95.75 | 7.68% | 3 |
| Last Price | Previous | % Change | Y-t-D | |
| $/LBP | 1,513.50 | 1,514.25 | -0.05% | |
| €/LBP | 1,843.82 | 1,848.80 | -0.27% | |
| £/LBP | 2,072.96 | 2,079.45 | -0.31% | |
| NEER | 109.80 | 110.54 | -0.66% | -7.26% |
Closing Date: 16 January 2018