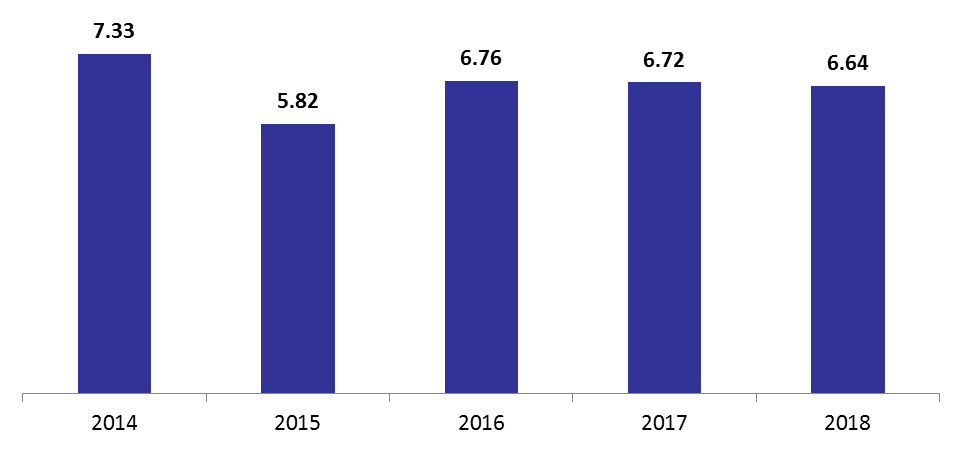
Lebanon’s trade deficit dropped by 1.1% year on year (y-o-y) hitting $6.64B by May 2018 as an outcome of a 9.7% annual increase in exports to $1.32B, which outweighed the 0.5% increase in imports touching $7.96B.
The leading imported goods to Lebanon were Mineral Products (17.17% of total imports) which decreased by 15.65% y-o-y to $1.36B on the back of a 45.17% y-o-y decline in the imported quantity of Mineral Fuels to 2.27M tons by May 2018.
It is worthy to note that the lower oil imports for the period could have been justified by the large amounts imported in 2017 (totaling 16M Tons) prior to the increase of the VAT rate to 11%, effective January 2018. However, the customs data on oil imports for 2017 and 2016 were revised, such that the total volume of mineral fuels in 2017 now stands at 9.08M Tons instead of 16M Tons and 9.24M Tons for 2016 instead of 7.68M Tons.
In their turn, Products of Chemical or Allied Industries (11.84% of total imports) increased by 8.31% y-o-y to $942.76M, followed by Machinery & Electrical instruments (11.39% of total imports) which increased by 15.56% y-o-y to $907.25M. As for Vehicles and Transport Equipment (8.47% of total imports), they decreased by 10.33% y-o-y to $674.22M.
By May, the 3 main import destinations were China, Italy and Greece with shares of 11%, 9% and 8%, respectively.
In terms of exported goods, Pearls, Precious stones and Metals (grasping 25.96% of total exports) rose by a yearly 22.98%, reaching $343.96M by May 2018. This increase may be attributed to the 12.5% y-o-y uptick recorded in the volume of Pearls, Precious stones and Metals to 27 tons over the same period. Moreover, Base Metals and Article of Base Metal (13.86% of total exports) increased by 37.37% y-o-y to $183.66M. This is mainly justified by the 12% increase in steel volume to 192,472 tons in 2018 and to the 27% average price rise to $796.93 in 2018, contributing to a 50% hike in steel value which stroked $60.60M in 2018. However, Prepared Foodstuffs, Beverages and Tobacco (13.81% of total exports) decreased by 10.10% y-o-y to $182.91M, this was mainly due to the weakened economy in the UAE and Saudi Arabia.
Lebanon’s top export destinations were UAE, South Africa, Saudi Arabia and Switzerland with contributions of 13%, 10%, 7% and 7%, respectively.
Trade Deficit by May (in $B)

Source: Lebanese Customs