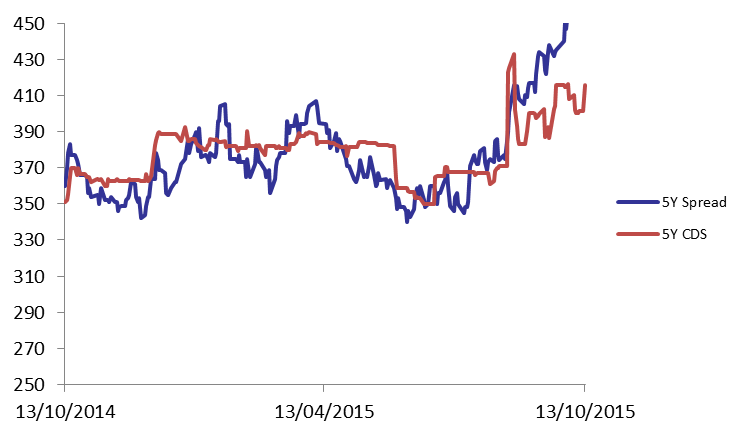
Demand for Lebanese Eurobonds was mixed on Tuesday which caused the BLOM Bond Index (BBI) to slightly decline by 0.01% to 104.89 points, broadening its year-to-date loss to 2.40%. Yield on the 10Y Lebanese Eurobonds dropped by 6 basis points (bps) to 6.42%, while that of the 5Y steadied at 5.96%. In the US, demand for medium term maturities improved causing the 5Y spread between the Lebanese Eurobonds and their U.S comparable to broadenby 5 basis points (bps) to 460 bps. As for the Lebanese 5Y Credit Default Swaps (CDS), they widened from their previous quotes of 390-413 bps to 403-428 bps.
| Last | Previous | Change | Y-t-D Change | ||
| BBI | 104.886 | 104.899 | -0.012% | -2.40% | |
| Weighted Yield | 5.93% | 5.93% | 0 | bps | |
| Duration (Years) | 4.94 | 4.94 | |||
| 5Y Bond Yield | 5.96% | 5.96% | 0 | bps | |
| 5Y Spread* | 460 | 455 | 5 | bps | |
| 10Y Bond Yield | 6.42% | 6.48% | -6 | bps | |
| 10Y Spread* | 436 | 436 | 0 | bps | |
*Between Lebanese and U.S notes
| Price | Yield | Yield Change (in bps) | |
| Nov. 2016 | 100.4 | 4.35% | 0 |
| Mar. 2017 | 105.5 | 4.98% | -1 |
| Oct. 2017 | 99.75 | 5.13% | 7 |
| Jun. 2018 | 99.75 | 5.25% | 0 |
| Nov. 2018 | 99.5 | 5.33% | 0 |
| Apr. 2019 | 100 | 5.50% | 0 |
| May. 2019 | 101.25 | 5.61% | 0 |
| Nov.2019 | 99 | 5.72% | 0 |
| Mar. 2020 | 102 | 5.85% | 3 |
| Apr. 2020 | 99.75 | 5.86% | 0 |
| Apr. 2021 | 109.75 | 6.13% | 5 |
| Oct. 2022 | 99.63 | 6.17% | 2 |
| Jan. 2023 | 99 | 6.17% | -2 |
| Dec. 2024 | 104.38 | 6.36% | -2 |
| Feb. 2025 | 98.63 | 6.40% | -2 |
| Jun. 2025 | 98.63 | 6.44% | -2 |
| Nov. 2026 | 100.13 | 6.58% | -2 |
| Nov. 2027 | 100.88 | 6.64% | -2 |
| Feb. 2030 | 99 | 6.76% | 0 |