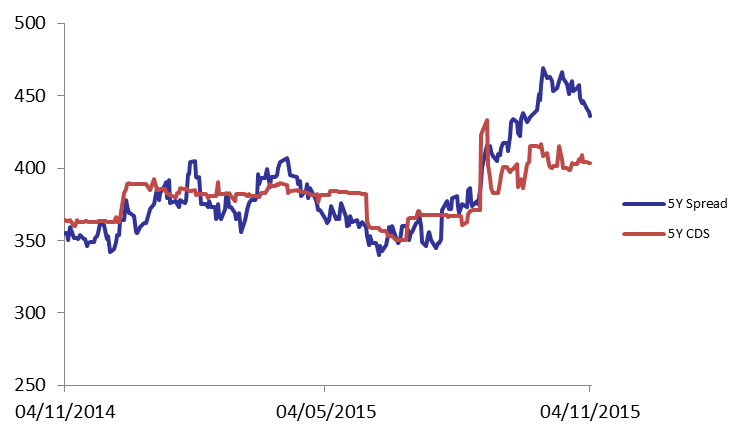
Demand for Lebanese Eurobonds regressed on Wednesday, which led the BLOM Bond Index (BBI) to drop by 0.07% to 104.78 points, broadening its year-to-date loss to 2.50%. Yields on the 5Y and 10Y Lebanese Eurobonds went up by 2 basis points (bps) and 1 bp to 6.00% and 6.48%, respectively. Similarly, demand for medium term maturities in the U.S. declined but at a faster pace than that of its Lebanese counterpart, causing the 5Y spread between both notes to narrow by 3 bps to 436 bps. As for the Lebanese 5Y Credit Default Swaps (CDS), they steadied at 391-416 bps.
| Last | Previous | Change | Y-t-D Change | ||
| BBI | 104.782 | 104.856 | -0.071% | -2.50% | |
| Weighted Yield | 5.94% | 5.93% | 1 | bps | |
| Duration (Years) | 4.88 | 4.89 | |||
| 5Y Bond Yield | 6.00% | 5.98% | 2 | bps | |
| 5Y Spread* | 436 | 439 | -3 | bps | |
| 10Y Bond Yield | 6.48% | 6.47% | 1 | bps | |
| 10Y Spread* | 423 | 424 | -1 | bps | |
*Between Lebanese and U.S notes
| Price | Yield | Yield Change (in bps) | |
| Nov. 2016 | 100.38 | 4.36% | 0 |
| Mar. 2017 | 105.38 | 4.91% | -1 |
| Oct. 2017 | 99.75 | 5.14% | 0 |
| Jun. 2018 | 99.75 | 5.25% | 0 |
| Nov. 2018 | 99.5 | 5.33% | 0 |
| Apr. 2019 | 100 | 5.50% | 0 |
| May. 2019 | 101.25 | 5.61% | 0 |
| Nov.2019 | 98.88 | 5.76% | -4 |
| Mar. 2020 | 102.13 | 5.81% | -3 |
| Apr. 2020 | 99.75 | 5.86% | 0 |
| Apr. 2021 | 109.75 | 6.11% | 5 |
| Oct. 2022 | 99.63 | 6.17% | 0 |
| Jan. 2023 | 98.63 | 6.24% | 4 |
| Dec. 2024 | 104.38 | 6.36% | -2 |
| Feb. 2025 | 98.63 | 6.40% | 2 |
| Jun. 2025 | 98.75 | 6.43% | 0 |
| Nov. 2026 | 99.88 | 6.61% | 3 |
| Nov. 2027 | 100.63 | 6.67% | 4 |
| Feb. 2030 | 98.38 | 6.83% | 1 |