Discover today’s performance of BLOM indices, the closing prices of Lebanese stocks and Eurobonds, as well as the exchange rate of major currencies against the LBP.
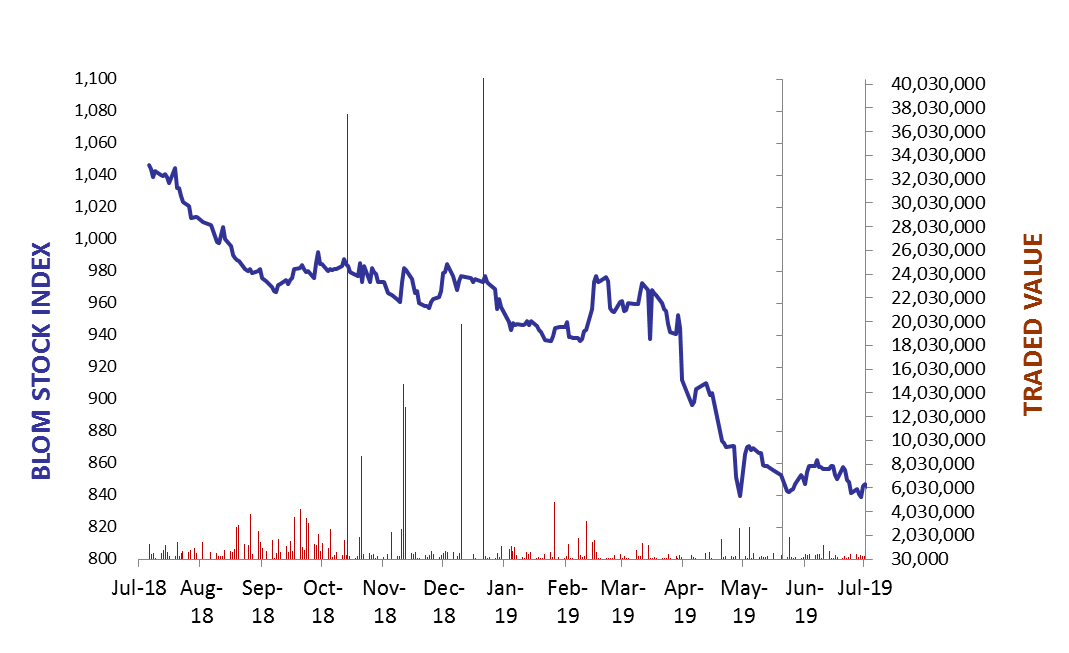
BLOM Stock Index (BSI) – today’s performance
| Last | Previous | % Change | Y-t-D Change | |
| BSI | 842.79 | 847.27 | -0.53% | -13.72% |
| High | 847.30 | 848.20 | ||
| Low | 839.90 | 839.90 | ` | |
| Volume | 255,854 | 123,329 | ||
| Val ($) | 521,094 | 685,085 |
I): BLOM preferred Shares Index (BPSI): today’s Performance
| Last | Previous | Change | |
| BPSI | 82.43 | 82.43 | 0.00% |
| Volume | |||
| Value |
Lebanese Stocks: today’s Trades and Closing Prices
| Last Price ($) | % Change | Volume | VWAP ($) | |
| Solidere A | 6.28 | -5.28% | 23,931 | 6.35 |
| Solidere B | 6.44 | -2.28% | 16,029 | 6.44 |
| Bank Audi | 3.86 | 0.26% | 1,400 | 3.86 |
| Byblos Bank – Listed Shares | 1.2 | 0.00% | 213,994 | 1.20 |
| BLOM GDR | 7.55 | -0.53% | 500 | 7.55 |
The BLOM Stock Index
Lebanese Global Depository Receipts: Last session’s Performance
| GDRs | Last Price ($) | Previous Price ($) | % Change | Volume | Value ($) |
| BLOM GDR | 7.15 | 7.5 | -4.67% | 35,679 | 262,963 |
| Audi GDR | 3.96 | 3.96 | 0.00% | – | – |
| Byblos GDR | 77 | 77 | 0.00% | – | – |
Closing Date: 23 July 2019
Source: London Stock Exchange
BLOM BOND INDEX: Last Session’s Performance
| Last | Previous | Change | Y-t-D Change | ||
| BBI | 88.78 | 88.53 | 0.28% | -12.16% | |
| Weighted Yield | 11.06% | 11.11% | -5 | bps | |
| Duration (Years) | 5.09 | 5.08 | |||
| 5Y Bond Yield | 11.72% | 11.80% | -8 | bps | |
| 5Y Spread* | 993 | 1003 | -10 | bps | |
| 10Y Bond Yield | 10.80% | 10.82% | -2 | bps | |
| 10Y Spread* | 886 | 890 | -4 | bps | |
*between Lebanese Eurobonds and US Treasuries
Closing Date: 23 July 2019
Lebanese Eurobonds: Last Sessions’ Prices and Yields
| Price | Yield | Yield Change | |
| 12/04/2021 | 93.84 | 12.31% | -5 |
| 04/10/2022 | 85.44 | 11.68% | -1 |
| 27/01/2023 | 83.78 | 11.77% | -2 |
| 22/04/2024 | 82.17 | 11.64% | -5 |
| 04/11/2024 | 79.79 | 11.45% | -3 |
| 03/12/2024 | 82.04 | 11.59% | -1 |
| 26/02/2025 | 79.79 | 11.15% | -3 |
| 12/06/2025 | 80.33 | 10.86% | -3 |
| 28/11/2026 | 78.88 | 10.84% | -5 |
| 23/03/2027 | 79.13 | 10.94% | -5 |
| 29/11/2027 | 78.21 | 10.77% | -7 |
| 03/11/2028 | 78.33 | 10.33% | -3 |
| 26/02/2030 | 76.92 | 10.27% | -7 |
| 22/04/2031 | 77.57 | 10.34% | -8 |
| 23/03/2032 | 78.58 | 10.02% | -10 |
| 02/11/2035 | 76.67 | 9.98% | -9 |
| 23/03/2037 | 77.41 | 10.00% | -9 |
Lebanese Forex Market
| Last Price | Previous | % Change | Y-t-D | |
| $/LBP | 1,514.25 | 1,514.25 | – | |
| €/LBP | 1,679.96 | 1,681.01 | -0.06% | |
| £/LBP | 1,881.96 | 1,874.73 | 0.39% | |
| NEER | 118.68 | 118.52 | 0.13% |
Closing Date: 24 July 2019