Discover today’s performance of BLOM indices, the closing prices of Lebanese stocks and Eurobonds, as well as the exchange rate of major currencies against the LBP.
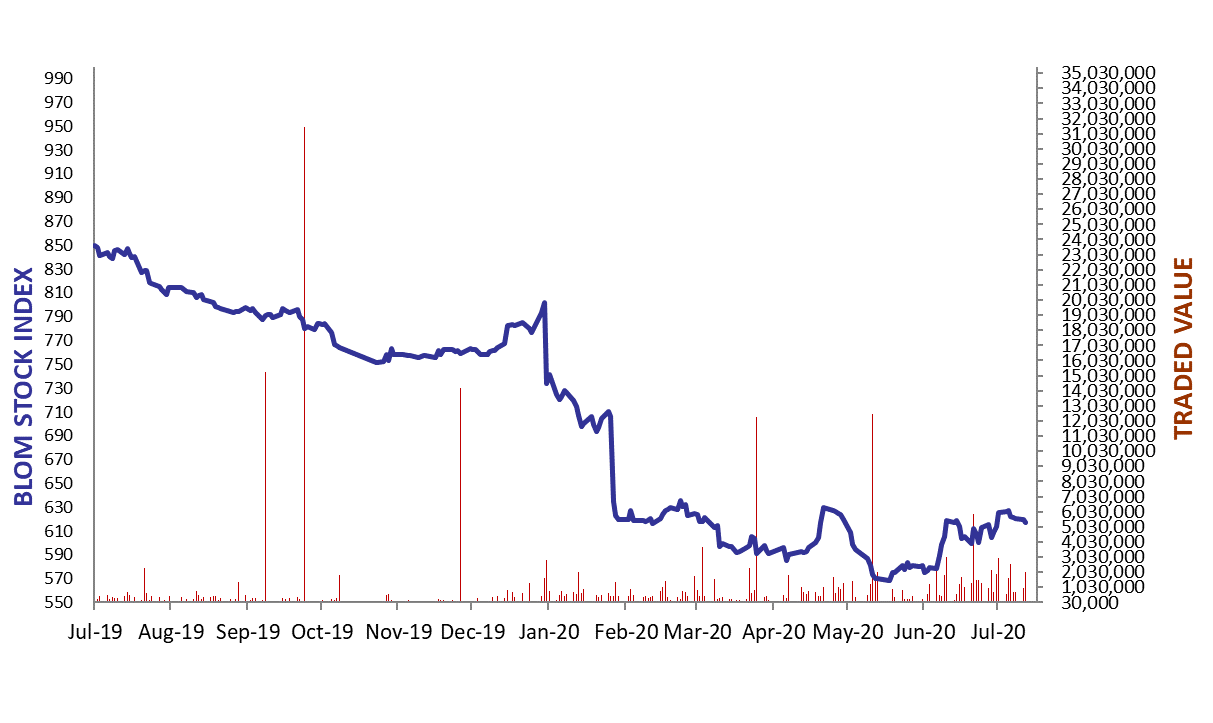
BLOM Stock Index (BSI) – today’s performance
| Last | Previous | % Change | Y-t-D Change | |
| BSI | 617.17 | 619.68 | -0.41% | -21.43% |
| High | 620.20 | 623.00 | ||
| Low | 616.02 | 617.02 | ||
| Volume | 146,753 | 71,442 | ||
| Val ($) | 2,066,560 | 950,216 |
I): BLOM preferred Shares Index (BPSI): today’s Performance
| Last | Previous | Change | |
| BPSI | 60.02 | 60.02 | 0.00% |
| Volume | |||
| Value |
Lebanese Stocks: today’s Trades and Closing Prices
| Last Price ($) | % Change | Volume | VWAP ($) | |
| Solidere A | 14.60 | -2.08% | 129,213 | 14.64 |
| Solidere B | 14.74 | -0.07% | 11,540 | 14.62 |
| Audi Listed | 0.96 | 1.05% | 6,000 | 1 |
Closing Date: July 21 2020
The BLOM Stock Index
Lebanese Global Depository Receipts: Last Session’s Performance
| Global Depository Receipts (GDRs) | Last Price ($) | Previous Price ($) | % Change | Volume | Value ($) |
| BLOM GDR | 1.30 | 1.30 | 0.00% | ||
| Audi GDR | 0.41 | 0.41 | 0.00% | 5,000,000 | 2,050,000 |
| Byblos GDR | 70 | 70 | 0.00% | – | – |
Closing Date: July 17, 2020
Source: London Stock Exchange
BLOM BOND INDEX: Last Session’s Performance
| Last | Previous | Change | Y-t-D Change | ||
| BBI | 15.99 | 15.78 | 1.35% | -68.36% | |
| Weighted Yield | 63.66% | 64.14% | -47 | bps | |
| Duration (Years) | 2.70 | 2.69 | |||
| 5Y Bond Yield | 111.00% | 111.00% | 0 | bps | |
| 5Y Spread* | 11,084 | 11,086 | -2 | bps | |
| 10Y Bond Yield | 50.30% | 51.20% | -90 | bps | |
| 10Y Spread* | 5,001 | 5,091 | -90 | bps | |
*spread between Lebanese Eurobonds and US Treasuries
Closing Date: July 20, 2020
Lebanese Eurobonds: Last Sessions’ Prices and Yields
| Price | Yield | Yield Change | |
| 10/4/2022 | 17.75 | 115.70% | (6) |
| 1/27/2023 | 17.21 | 103.84% | (50) |
| 4/22/2024 | 16.94 | 75.39% | (46) |
| 11/4/2024 | 16.88 | 66.87% | (24) |
| 12/3/2024 | 16.54 | 69.70% | (99) |
| 2/26/2025 | 16.71 | 63.82% | (23) |
| 6/12/2025 | 17.46 | 59.44% | (23) |
| 11/28/2026 | 16.63 | 53.36% | (64) |
| 3/23/2027 | 16.63 | 52.96% | (84) |
| 11/29/2027 | 16.58 | 50.18% | (55) |
| 11/3/2028 | 16.75 | 46.81% | (89) |
| 2/26/2030 | 16.88 | 44.10% | (131) |
| 4/22/2031 | 15.83 | 46.69% | 62 |
| 3/23/2032 | 16.50 | 44.32% | (18) |
| 11/2/2035 | 16.88 | 42.17% | (10) |
| 3/23/2037 | 17.13 | 42.47% | 0 |
Lebanese Forex Market
| Last Price | Previous | % Change | Y-t-D | |
| $/LBP | 1,514.25 | 1,514.25 | – | |
| €/LBP | 1,724.43 | 1,706.19 | 1.07% | |
| £/LBP | 1,914.07 | 1,905.48 | 0.45% | |
| NEER | 128.11 | 128.17 | -0.05% |
Closing Date: July 21, 2020