Discover today’s performance of BLOM indices, the closing prices of Lebanese stocks and Eurobonds, as well as the exchange rate of major currencies against the LBP.
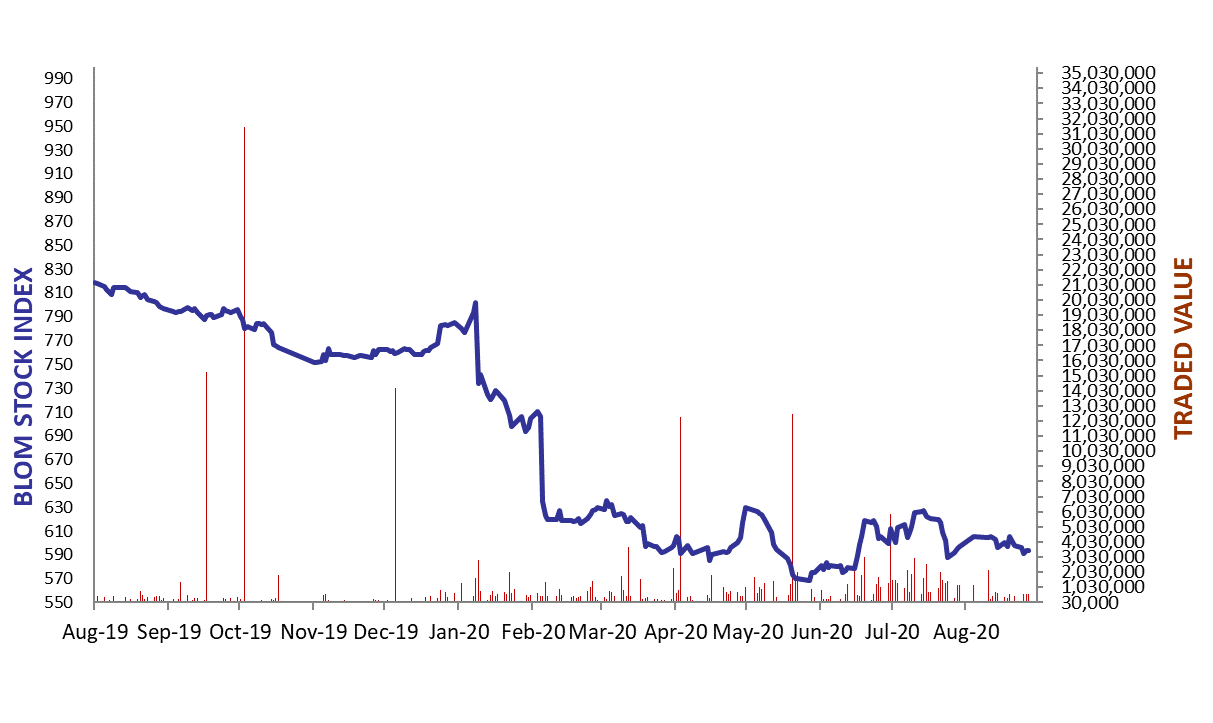
BLOM Stock Index (BSI) – today’s performance
| Last | Previous | % Change | Y-t-D Change | |
| BSI | 593.18 | 593.67 | -0.08% | -24.49% |
| High | 594.52 | 595.66 | ||
| Low | 591.24 | 589.84 | ||
| Volume | 60,784 | 38,426 | ||
| Val ($) | 842,722 | 556,267 |
I): BLOM preferred Shares Index (BPSI): today’s Performance
| Last | Previous | Change | |
| BPSI | 61.32 | 61.32 | 0.00% |
| Volume | 500 | ||
| Value | 22,450 |
Lebanese Stocks: today’s Trades and Closing Prices
| Last Price ($) | % Change | Volume | VWAP ($) | |
| Solidere A | 14.07 | 0.43% | 16,116 | 14.10 |
| Solidere B | 14.01 | -1.20% | 43,935 | 14.00 |
| Byblos Bank- Listed shares | 0.39 | 0.00% | 733 | 0.39 |
Closing Date: August 27, 2020
The BLOM Stock Index
Lebanese Global Depository Receipts: Last Session’s Performance
| Global Depository Receipts (GDRs) | Last Price ($) | Previous Price ($) | % Change | Volume | Value ($) |
| BLOM GDR | 1.30 | 1.30 | 0.00% | 16,600 | 21,580 |
| Audi GDR | 0.36 | 0.35 | 2.86% | 64,596 | 23,255 |
| Byblos GDR | 70 | 70 | 0.00% |
Closing Date: August 26, 2020
Source: London Stock Exchange
BLOM BOND INDEX: Last Session’s Performance
| Last | Previous | Change | Y-t-D Change | ||
| BBI | 15.17 | 15.06 | 0.74% | -69.99% | |
| Weighted Yield | 67.53% | 67.80% | -27 | bps | |
| Duration (Years) | 2.60 | 2.51 | |||
| 5Y Bond Yield | 62.10% | 62.20% | -10 | bps | |
| 5Y Spread* | 6,210 | 6,204 | 6 | bps | |
| 10Y Bond Yield | 46.80% | 47.10% | -30 | bps | |
| 10Y Spread* | 4,680 | 4,682 | -2 | bps | |
*spread between Lebanese Eurobonds and US Treasuries
Closing Date: August 26, 2020
Lebanese Eurobonds: Last Sessions’ Prices and Yields
| Price | Yield | Yield Change | |
| 10/4/2022 | 17.24 | 124.12% | 18 |
| 1/27/2023 | 16.30 | 111.91% | (7) |
| 4/22/2024 | 15.38 | 82.22% | 5 |
| 11/4/2024 | 15.95 | 70.70% | (10) |
| 12/3/2024 | 15.95 | 72.54% | (71) |
| 2/26/2025 | 15.80 | 67.54% | 4 |
| 6/12/2025 | 16.60 | 62.33% | 2 |
| 11/28/2026 | 15.70 | 56.01% | 1 |
| 3/23/2027 | 15.68 | 55.78% | (77) |
| 11/29/2027 | 15.95 | 51.94% | (59) |
| 11/3/2028 | 15.98 | 48.77% | (55) |
| 2/26/2030 | 15.76 | 46.87% | (20) |
| 4/22/2031 | 15.92 | 46.60% | (64) |
| 3/23/2032 | 16.08 | 45.48% | (58) |
| 11/2/2035 | 15.63 | 45.37% | (34) |
| 3/23/2037 | 15.87 | 45.80% | (106) |
Lebanese Forex Market
| Last Price | Previous | % Change | Y-t-D | |
| $/LBP | 1,514.25 | 1,514.25 | – | |
| €/LBP | 1,782.17 | 1,783.37 | -0.07% | |
| £/LBP | 1,990.50 | 1,991.41 | -0.05% | |
| NEER | 127.48 | 127.57 | -0.07% |
Closing Date: August 27, 2020