Discover today’s performance of BLOM indices, the closing prices of Lebanese stocks and Eurobonds, as well as the exchange rate of major currencies against the LBP.
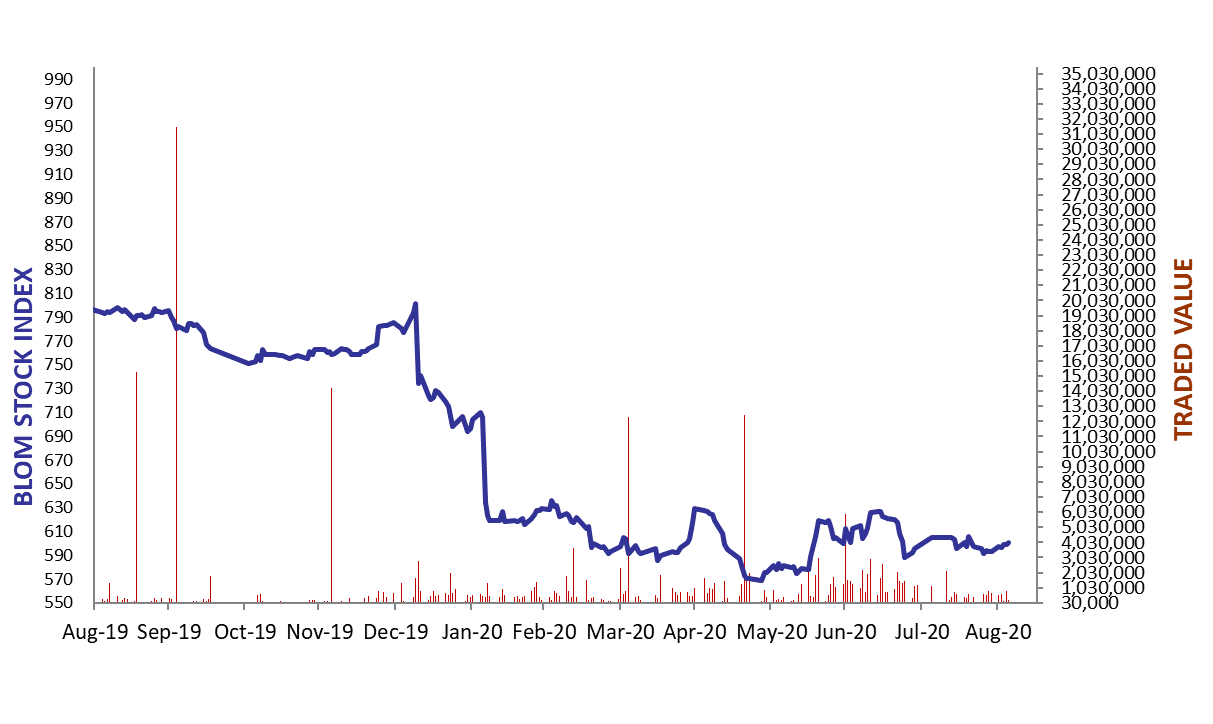
BLOM Stock Index (BSI) – today’s performance
| Last | Previous | % Change | Y-t-D Change | |
| BSI | 600.87 | 599.26 | 0.27% | -23.51% |
| High | 602.17 | 600.20 | ||
| Low | 599.17 | 598.88 | ||
| Volume | 26,664 | 56,177 | ||
| Val ($) | 238,590 | 815,108 |
I): BLOM preferred Shares Index (BPSI): today’s Performance
| Last | Previous | Change | |
| BPSI | 61.32 | 61.32 | 0.00% |
| Volume | |||
| Value |
Lebanese Stocks: today’s Trades and Closing Prices
| Last Price ($) | % Change | Volume | VWAP ($) | |
| Solidere A | 14.61 | 0.69% | 9,788 | 14.59 |
| Solidere B | 14.60 | 0.69% | 6,285 | 14.58 |
| Byblos Bank- Listed shares | 0.39 | 0.00% | 10,591 | 0.39 |
Closing Date: September 4, 2020
The BLOM Stock Index
Lebanese Global Depository Receipts: Last Session’s Performance
| Global Depository Receipts (GDRs) | Last Price ($) | Previous Price ($) | % Change | Volume | Value ($) |
| BLOM GDR | 1.50 | 1.50 | 0.00% | 14,700 | 22,050 |
| Audi GDR | 0.36 | 0.36 | 0.00% | ||
| Byblos GDR | 70 | 70 | 0.00% |
Closing Date: September 2, 2020
Source: London Stock Exchange
BLOM BOND INDEX: Last Session’s Performance
| Last | Previous | Change | Y-t-D Change | ||
| BBI | 16.59 | 16.40 | 1.16% | -67.19% | |
| Weighted Yield | 63.61% | 64.13% | -52 | bps | |
| Duration (Years) | 2.73 | 2.71 | |||
| 5Y Bond Yield | 58.40% | 59.00% | -60 | bps | |
| 5Y Spread* | 5,840 | 5,887 | -47 | bps | |
| 10Y Bond Yield | 44.10% | 44.30% | -20 | bps | |
| 10Y Spread* | 4,410 | 4,406 | 4 | bps | |
*spread between Lebanese Eurobonds and US Treasuries
Closing Date: September 3, 2020
Lebanese Eurobonds: Last Sessions’ Prices and Yields
| Price | Yield | Yield Change | |
| 10/4/2022 | 18.38 | 119.80% | (30) |
| 1/27/2023 | 17.82 | 105.99% | (182) |
| 4/22/2024 | 17.25 | 76.48% | (71) |
| 11/4/2024 | 17.43 | 66.87% | (20) |
| 12/3/2024 | 17.42 | 68.55% | (42) |
| 2/26/2025 | 17.43 | 63.37% | (60) |
| 6/12/2025 | 18.23 | 58.64% | (54) |
| 11/28/2026 | 17.43 | 52.13% | (52) |
| 3/23/2027 | 17.25 | 52.17% | (54) |
| 11/29/2027 | 17.43 | 48.73% | (35) |
| 11/3/2028 | 17.35 | 45.88% | (70) |
| 2/26/2030 | 17.00 | 44.12% | (10) |
| 4/22/2031 | 17.00 | 44.14% | (36) |
| 3/23/2032 | 17.35 | 42.62% | (21) |
| 11/2/2035 | 17.50 | 40.81% | (55) |
| 3/23/2037 | 17.63 | 41.43% | (28) |
Lebanese Forex Market
| Last Price | Previous | % Change | Y-t-D | |
| $/LBP | 1,514.25 | 1,514.25 | – | |
| €/LBP | 1,785.18 | 1,786.69 | -0.08% | |
| £/LBP | 2,001.36 | 2,002.11 | -0.04% | |
| NEER | 127.48 | 127.54 | -0.05% |
Closing Date: September 4, 2020